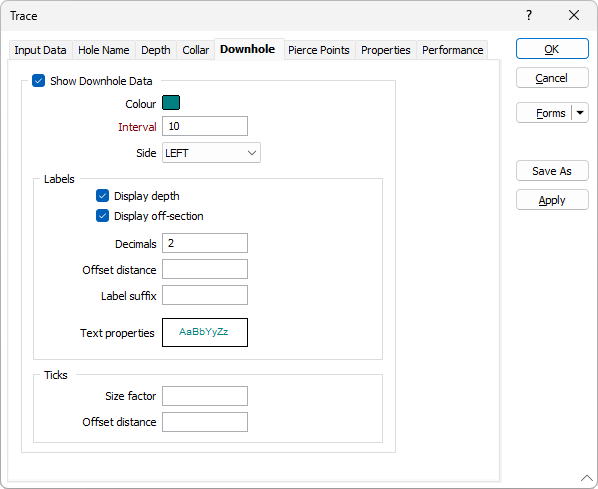
Downhole Data
Select the Show Downhole Data check box option in the Downhole Data tab, if you want to display data along the drillhole trace.
Colour
Select a colour to be used to display the downhole data labels and ticks.
Interval
Enter the downhole interval at which to display labels and ticks. Use grid units. This field is mandatory.
Side
Choose which side of the trace the values or graphs will be displayed. Ideally, you position character values on the right-hand side of the drillhole trace and numeric values on the left.
Labels
If you want to label downhole data, you can optionally select or enter values in the Labels box.
Display depth/ offsection
For each interval, specify whether to display depth or offsection values, or both.
Decimals
Enter the number of decimal places that will be used when displaying depth values.
Offset distance
Enter an offset, measured from the trace, at which the label will be displayed. It must be entered in grid units.
Label Suffix
Optionally, enter any additional text to be displayed at the end of the depth or offsection value.
Text Properties
Double-click on the Text Properties Preview box to select a font and set text properties.
Ticks
Ticks are small line segments that extend perpendicular to a trace. They relate trace information to a point on the trace. By default, ticks are joined to the trace.
Size factor
Enter a factor to control the length of all ticks. The default is 1.0. This factor changes the size of the tick in the display.
Offset distance
Enter an offset, measured from the trace, at which the tick will be displayed. It must be entered in grid units.