Display
Use the options provided in the Display tab to set the position, size and appearance of the Interval labels and the ticks that will be used to display Interval label values down the hole.
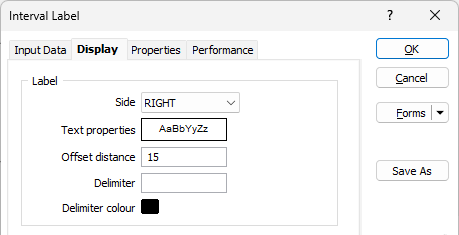
Side
Values can be displayed on the LEFT or RIGHT of the drillhole trace. Use Side to determine their location.
Text Properties
Double-click on the Text Properties Preview box to select a font and set text properties.
Offset distance (labels)
Define the distance, in grid units, that the first character of each label will be offset from the trace. The default is 1. Both positive and negative values are acceptable.
Delimiter
Optionally, specify a delimiter (i.e. a comma or colon) to be used to delimit the display values selected in the Value Coordinates tab. If you have specified a delimiter, you can also specify a display colour for the delimiter.
Delimiter colour
Double click (F3) to select the colour to be applied to the delimiter.
Display Header
Select the Display header option to display a header for each label field specified on the Input tab of the form. You can choose to align the header so that it is parallel to the trace, rather than perpendicular (the default).
You can either use the default colour of each label specified on the Input tab of the form, or specify a custom colour.
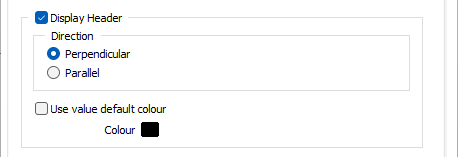
Use value default colour
Select this option to use the default colour applied to the labels, as the colour for the header.
Colour field
If you have not selected the Use value default colour option, double click (F3) to select the colour that will be used for the header.
Ticks
Ticks are small line segments that extend perpendicular to the trace. They relate trace information to a point on the trace. You can define the tick offset distance in grid units. By default the ticks will be joined to the trace. The size factor you apply to the ticks will be applied both in the display and in the plot.
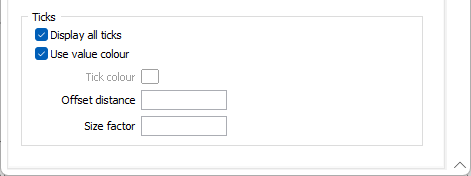
Display all ticks
Select this option if you want all sample intervals to be shown, even if they do not contain data. Ticks will be drawn for all intervals defined in the nominated file. When Display all ticks is cleared, ticks will only be drawn for intervals with a value in the Value field (i.e. the field is not blank). Normally this option is not selected and only the ticks that define intervals with data are shown.
Use value colour
Select this option when you want the bottom tick for any interval and the top tick of the first interval to be drawn using the same colour as the label. If all ticks are to be the same colour, clear this check box and select the Tick colour.
Tick colour
Double click (F3) to select the colour to be applied to the ticks in the display.
Offset distance (ticks)
Enter an offset, measured from the trace, at which the tick will be displayed. It must be entered in grid units
Size factor
Enter a factor to control the length of all ticks. The default is 1.0. This factor changes the size of the tick on the display.