Drillholes in Vizex
On the Home tab or the Vizex tab, in the Layer group:
-
Select Open Layer | Drillhole | Trace (or double-click Drillhole Trace in the Vizex Layer Types pane) to display a drillhole trace.

The same option is available on the Drillhole tab, in the Generate group.
-
Select Open Layer | Drillhole | Solid Trace (or double-click Solid Drillhole Trace form set type in the Vizex Layer Types pane) to displays drillholes as cylindrical solids.

-
Select Open Layer | Drillhole | Imaging (or double-click Imaging form set type in the Vizex Layer Types pane) to display whole-core images in their true 3D location.

-
Select Open Layer | Drillhole | Interval Label (or double-click Interval Label form set type in the Vizex Layer Types pane) to label Interval values in Vizex.

-
Select Open Layer | Drillhole | Interval Hatch (or double-click Interval Hatch form set type in the Vizex Layer Types pane) to display Interval Hatches in Vizex.

-
Select Open Layer | Drillhole | Interval Graph (or double-click the Interval Graph form set type in the Vizex Layer Types pane) to display a drillhole graph.

-
Select Open Layer | Drillhole | Event (or double-click the Event form set type in the Vizex Layer Types pane) to display downhole events in a Vizex.

-
Select Open Layer | Drillhole | Oriented Structure to display structural drillhole strings along a hole.

-
Select Open Layer | Drillhole | Seam Correlation (or double-click the Seam Correlation form set type in the Vizex Layer Types pane) to create a 3D seam correlation diagram from drillhole interval data.

-
Select Planning to open the Drillhole | Planning ribbon and put the Vizex window in Planning mode.

There are a number of functions you can use to analyse drillhole data in section, plan, or hole by hole. These displays can also handle data such as underground channel sampling or trenches.
Drillhole traces can be viewed in any orientation with clipping planes positioned either side of the section. The line representing the trace can be colour coded by using a Numeric or Character field in any associated Interval file.
The collar and end of hole can be annotated using various options and further detail on either side of the trace can include:
- Depth
- Distance from the section
- Multiple text values, individually colour coded
- Symbols
- Bar and line graphs
- Hatching with complete control over offset, width, pattern and colour
- Lines representing the apparent dip of a structure
In many cases the display can also include background data such as seams, faults and outcrops, images, outlines and gridded surfaces.
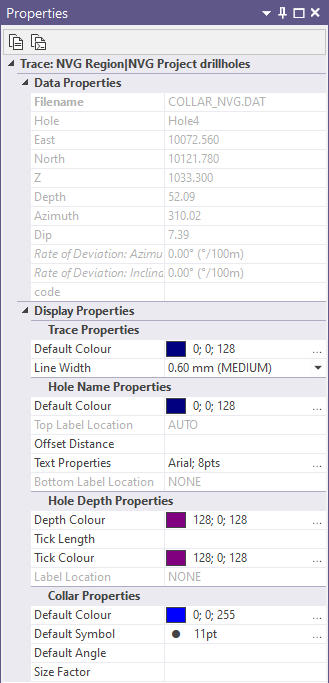
Note that some display properties may be viewed and edited in the Vizex Property Window: