Draping
On the Draping tab of the Wireframe form, enter parameters to drape an image or a grid surface onto the wireframe.
Any part of the wireframe not covered by the image or the grid is drawn in the default colour. This is either the wireframe colour, or, if the "Use Colour Coding" group box on the Draw Options tab is checked, the default colour defined there.
None
If drape options have already been applied, select this option to turn off the display of the draped image or grid.
Image
Select this option to select an image to drape over the wireframe.
Image file
Specify the name and path of the image file. To navigate to the location of the file, click on the ellipsis button (or press F3). Use the image preview function if necessary (right-click or press F4 with the cursor in the file prompt).
To improve the performance of the draping process for large images, a lower resolution image is initially draped on the wireframe (or grid) and is then gradually replaced by the higher resolution image.
Multi Band
If you have selected a multiband image file, click the Multi Band button to control the allocation of spectral bands to display colours. A common geological application of Landsat satellite imagery, for example, is to allocate the red, green, and blue display colours to spectral bands 7, 4, and 1.
The Display a multi band image button will only be enabled if the image file you select is a multi band image.
Clip to Image
Select this option to clip the wireframe to the image extents. This will make the wireframe outside of the image invisible. (The same effect can also be achieved by setting the wireframe colour to NULL.)
Transparent Colour
Select the option to pick a Colour to make transparent and set a Tolerance value for the transparency. Tolerance measures the allowed difference between the selected colour and the actual colour before transparency is not applied. The larger the value, the more difference between the colours that is allowed.
Transparent sections of the image, including areas that are made transparent using the Transparent colour option, and the areas outside of the image extents, will be rendered as th default colour for the wireframe (the colour specified under 3D colour coding, or the wireframe colour if this option is disabled).
If Clip to image is enabled, then the wireframe will be made invisible, and only the transparent sections of the image will be seen.
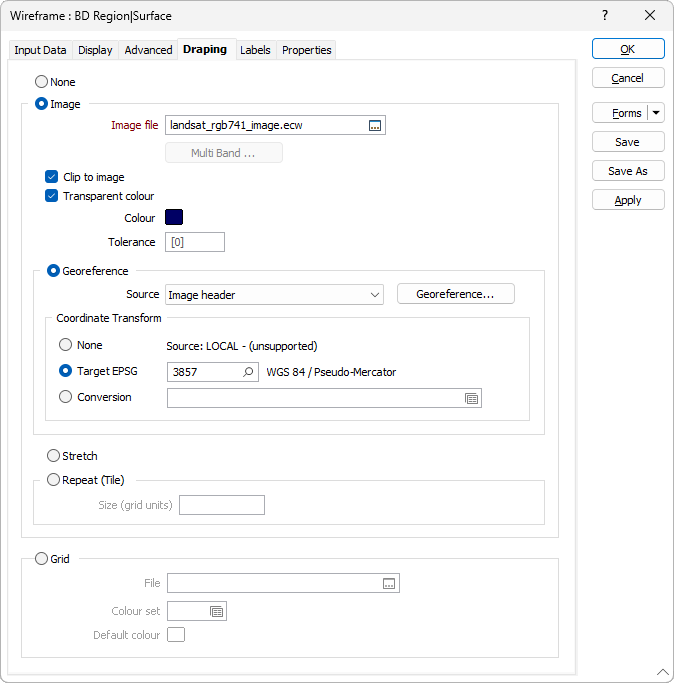
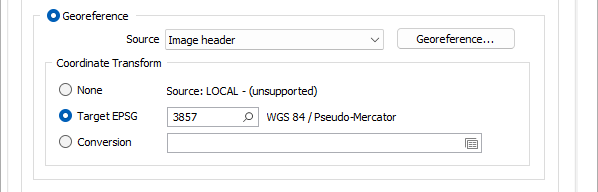
Georeference
If a Georeference Source file is detected, it will be used to obtain georeference information. To obtain georeferencing information from a different source, select an option from the drop-down list.
To interactively georeference the image click the Georeference Image button.
Conversion
To apply a coordinate system conversion to the
If you do not want to convert between coordinate systems as you load the image, select None.
Target EPSG
This option is only enabled if the Input file contains recognisable information about the coordinate system that it was registered in. The EPSG number and name of the source coordinate system are provided if they are recognised.
If the Target EPSG option is selected, then the
Stretch
Select this option to stretch the image so that it covers the extent of the wireframe.
Repeat (Tile)
Select this option to tile the image so that it covers the extent of the wireframe. Enter a Size value (in grid units) that will be used to calculate the width and height of each tile.
Grid
Select this option to select a grid to drape over the wireframe.
When you select this option, the Z values for each grid node are taken from the wireframe instead of the draped grid. Any colour coding you apply will still be based on the Z values from the grid.
To be useful, the wireframe and the grid must have overlapping coordinates. Nodes from the grid that fall outside the wireframe are not displayed.
Grid File
Double-click to select the name of the Grid file you want to load. This must be a file that was generated using the Create function on the Grid menu, or one of the conversion options.
Colour set
(Optional) Enter the number of a suitable colour set that will be used to colour-code the grid file.
Default colour
(Optional) Select the default colour in which the grid is to be displayed. This will be used when you have not defined a colour set.