Adjust Z Values
Z values represent height and are usually taken from the Z field, but can be anything you are interested in (Note that for block model data, you must use the Z field). For example, you could use sample data in the Z field to visualise assay values. These could then be colour-coded to represent relative grades.
In many cases you may want to adjust the Z values of a file before loading the data in Vizex, for example:
- To separate objects that would otherwise overlap or be too close.
- To bring objects into the same area when they would otherwise be too far apart. (When you are loading multiple objects, they must have sufficiently close coordinates or some may be out of view.)
- To exaggerate the Z values for easier comprehension of the data. For example, you may have a relatively flat contour with most Z values around 1000. By entering 1000 as the Base you can make the differences in height more pronounced and easier to examine.
The original data file remains unchanged. If you change Z values and want to use the same (changed) values again later, you need to select Save As... and save the data as a Form.
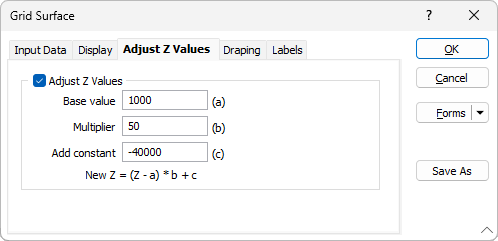
The Adjusted Z value is calculated by taking the original Z, subtracting a Base value, multiplying the result by a Multiplier and then adding a Constant.
The calculation expressed as a formula is:
New Z = (Z-a)*b+c
where:
a = Base value
b = Multiplier
c = Constant
Enter the three required values on the Adjust Z Values tab of the Grid Surface form. When you click OK, the adjusted values are calculated.