Input Data
![]()
Specify the following parameters on the Input Data tab of the Grid Surface form:
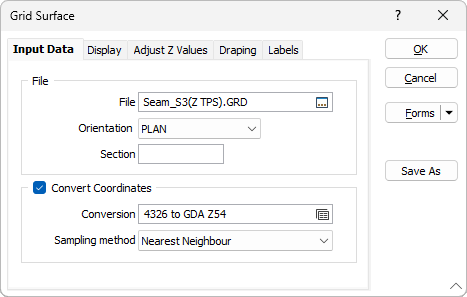
File
Double-click (F3) to select the name of the Grid file to load. You can right-click (F4) in the File box to preview the grid in an image viewer.
Orientation
Specify the orientation of the Grid Surface (i.e. PLAN, LOOKING WEST or LOOKING NORTH). The orientation you select here will determine what View Type you select when viewing the surface with other display objects.
Section
Optionally, specify a Section value.
The Section field allows you to position the Grid Surface at a specified 3D coordinate, the axis of which is determined by which orientation you select. For example, if the orientation is LOOKING NORTH and you enter a value of 15900, you will position the surface at a Northing of 15900. The Easting and elevation coordinates will be set by the limits of the grid.
The Orientation and Section options are especially useful for positioning non-plan surfaces, such as geophysical sections, in their true 3D locations.
You can display third-party Grid file formats as images (Vizex > Layers > Image). Or you can convert them to Micromine Australia Pty Ltd Grid Surface (*.GRD) file format (Files > Import > Grid (Raster) Data).
Convert Coordinates
Select the Convert Coordinates check box to convert between geographic coordinates (latitudes and longitudes) and projected or local coordinates, as part of the import process.
Conversion
Select, or create a new, coordinate conversion form set. See: Coordinate System Conversion
Sampling method
Select a sampling method:
| Method | Input Cells | Calculation | Properties |
|---|---|---|---|
|
Nearest Neighbour |
1 (1 × 1) |
Returns the nearest cell value |
|
|
Bilinear |
4 (2 × 2) |
Combined linear interpolations along the X and Y axes |
|
|
Cubic |
16 (4 × 4) |
Cubic convolution |
|
|
Cubic Spline |
|
Piecewise cubic polynomial |
|
|
Lanczos |
|
Windowed sine cardinal (Sinc) function |
|
Forms
Click the Forms button to select and open a saved form set, or if a form set has been loaded, save the current form set.
By design, the Forms button is not available for loaded Vizex layers (i.e. when opening the form set properties of a layer in the Vizex Layer Display pane). In Vizex, the Forms button is only available for new forms opened via the Home tab or the Vizex tab, in the Layer group (or by double-clicking on a form type node in the Vizex Layer Types pane).
Save and Save As
Click the Save button to save the changes you have made to the form set. Click Save As to save your changes as a new form set. Save As will default to the first available form set number.
Reset
Click Reset to clear the form of all values and reset the form to its default state.
Reset Tab
For tabbed forms, select Reset Tab to clear the active tab of all values and reset the tab to its default state - without making any changes to other tabs in the dialog.
Undo and Redo
Click Undo (CTRL + Z) to undo recent changes in the form. After an Undo, click Redo (CTRL + Y) to restore the last change that was undone.
Collapse
Collapse (roll-up) the form to preview a chart, or preview the results of an operation in Vizex, or obtain input values from Vizex, the Property Window, the File Editor, or the Plot Editor.
OK
Finally, click OK to load the Grid Surface. The display options, adjusted Z values, and label options you have specified, will be applied.