Display
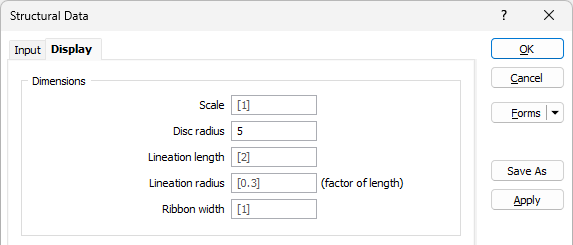
On the Display tab of the Structural Data form, you can set the dimensions and colours for the structural data display.
Dimensions
The options in the Dimensions section let you set values for scale, radius and length for the display.
Scale
Accept the default Scale or enter a value by which to scale the structural data display. The scale will act as a multiplier to the current dimension parameters.
Disc Radius
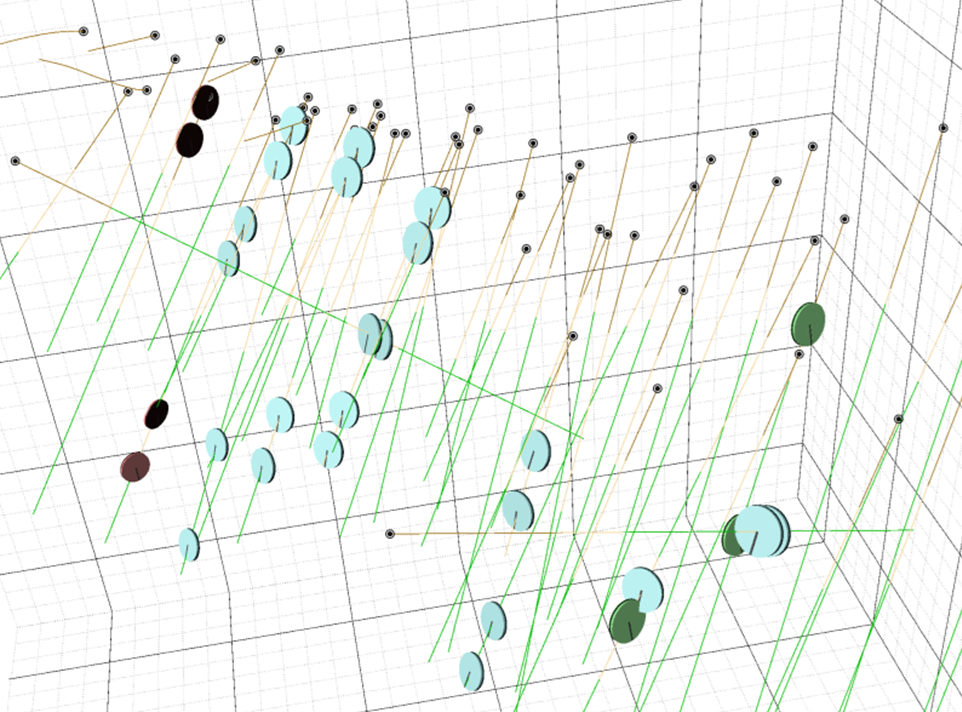
Enter a value for the Disc radius in the field provided. The radius value uses grid units and determines the size of each disc displayed in the structural data layer.
Lineation Length
Accept the default or enter a value for Lineation length. The lineation value determines the length (in grid units) of linear structures for the display.
Lineation Radius
Enter a value for the Lineation radius, to determine the radius of the linear structure points for the data display.
Ribbon width
Enter a value for the width of the polylines (ribbon) that are added to the structure points.

Colours
The Colours options are used to determine the colours used to display the structural data discs and cones.
Disc orientation line
Use the colour box to select the display colour for the orientation line within the disc. This line represents the dip direction of the structural data point.
Uniform
Select the Uniform option to apply uniform colour to the Disc Top, Disc Bottom and Lineation for the display.

Colour Set
Select the Colour Set option to apply a selected Colour set to the display using a specified Colour field. You can set the Default colour for the colour set display using the colour box provided.

Ribbon
Select a Colour for the Top and Bottom of the polyline strings (ribbon).

When the Display options have been configured as required, click OK to generate the structural data display.

The displayed structural data can be edited and moved interactively using the methods outlined in Interacting with Structural Data.