Display SEG-Y
Seismic surveying is an essential tool for stratified deposits such as coal. Seismic data is easily combined with drillholes in the application, providing another layer of information and improving the quality of the resulting models. Display options make it easy to configure the display so that it reveals the most information from the data.
On the Display tab of the 2D Seismic Seg-Y form, set the display properties of the SEG-Y data. Data can be drawn as traces and/or wiggles. The colour and the transparency of the data points can be adjusted based on the sample strength.
Trace
Select this check box to represent each trace in the SEG-Y file as a line. Unless trace lines are drawn, you cannot select traces individually or have access to their trace header properties.
You can define the default trace colour as the NULL colour to make the trace invisible but still selectable. You should only do this when a Fill is also defined (see below).
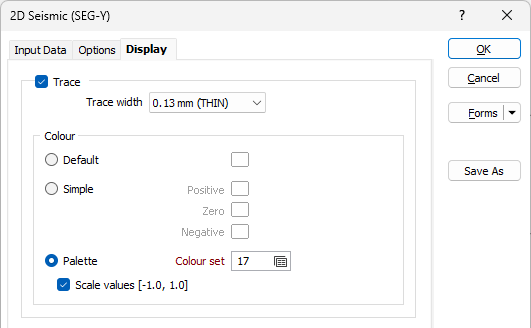
Trace width
Specify the width of the trace lines. You can choose from a wide selection of custom (in millimetres) widths.
Default
Select Default to specify a default colour for the trace lines. This colour will be assigned when sample values are missing in the SEG-Y file.
Simple
Select Simple to assign colours to positive/negative/zero sample values:
- The maximum sample in the SEG-Y will be assigned the colour chosen for Positive.
- The minimum sample in the SEG-Y will be assigned the colour chosen for Negative.
- Any zero samples will be assigned the colour chosen for Zero. The rest of the sample points will have their colour linearly interpolated between the Positive and Zero colour if they are a positive sample, or between the Negative and Zero colour if they are a negative sample.
- If a NULL colour is selected it will be assumed to be white.
Palette
Select the Palette option to apply a colour set using the colours defined in a Micromine palette.
To map values in the Colour field to the colour values in a Colour set, double click (F3) to select the set that will be used to control the display colour. Right-click (F4) to create or edit a Colour set.
Note that the colour set must be numeric and is expected to be in the range of [-1.0, 1.0]. To apply a colour palette to the raw data rather than scaled data values, clear the Scale values check box.
Fill
Select this check box to specify how the wiggles within the SEG-Y trace lines will be filled.
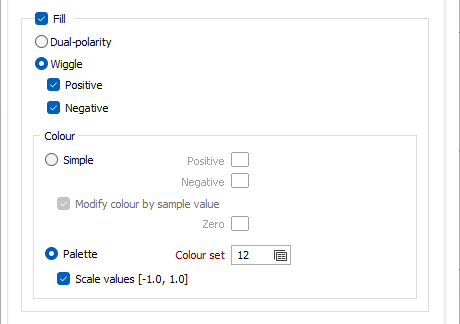
Dual Polarity
If this option is selected, both positive and negative samples will be drawn in the positive sample direction and both will be filled based on the colours chosen in 'Fill Colour' (below).
Wiggle
If this option is selected, the samples will be drawn in their respective directions with the option to fill positive and/or negative wiggles.
Simple
Specify the Positive colour and the Negative colour.
Optionally, select the Modify colour by sample value check box and specify a Zero colour. When this check box is selected, the fill colour will be calculated based on sample value (using the same logic described under 'Trace' above).
If a NULL colour is selected it will be assumed to be white.
Palette
Select Palette option to apply a colour set using the colours defined in a Micromine palette.
To map values in the Colour field to the colour values in a Colour set, double click (F3) to select the set that will be used to control the display colour. Right-click (F4) to create or edit a Colour set.
Note that the colour set must be numeric and is expected to be in the range of [-1.0, 1.0]. To apply a colour palette to the raw data rather than scaled data values, clear the Scale values check box.
Transparency
Use the slider bar to adjust the overall transparency of the SEG-Y display.
Modify by sample value
If this option is selected, the transparency of the objects in the SEG-Y display will be adjusted based on the sample value of each point.
![]()
A sample value of zero will be completely transparent. The maximum positive and negative sample values will have the transparency defined by the slider. The other samples will have their transparency calculated based on their value with respect to zero and the maximum value.
2D Seismic SEG-Y layers cannot be written to a Plot file. To include 2D Seismic SEG-Y information in a plot, either use Vizex > Plot > Generate Plots and then select the Plot As Image option, or use Vizex > Plot > Generate Vizex Plot.