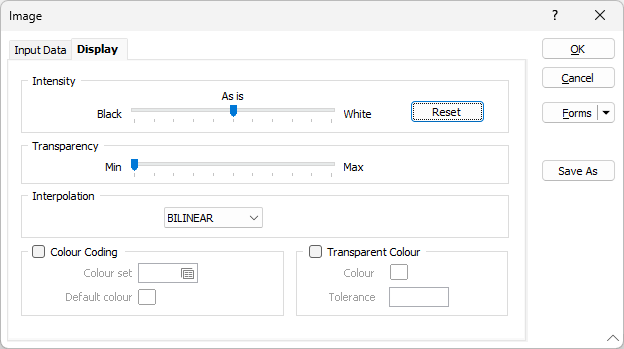
Display
On the Display tab of the Image form, you can set the intensity and the transparency of the image and select the method to be used to smooth or interpolate the pixels of the image.
Note that some display properties may be viewed and edited in the Vizex Property Window:
Intensity
Use the slider bar to Adjust the image intensity.
Transparency
Use the transparency slider to specify the transparency of the image. The layers displayed below the draped image can be seen based upon the degree of transparency you select.
Interpolation
Select an option to interpolate (or smooth) the pixels of the image. Interpolation is important when you need to display continuous tone data (air photos, satellite images, Vizex fly-throughs etc.) and zoom in beyond the native pixel size.
There are two options to choose from:
- BILINEAR. Bilinear interpolation (the default) is a simple interpolation method for zooming. The output pixel value is a weighted average of the pixels in the nearest 2-by-2 neighbourhood.
- NONE. This option has the effect of simply making each pixel bigger. The output pixel is assigned the value of the pixel that the point falls within. No other pixels are considered.
Colour Coding
When a file of the appropriate type, bit depth, and number of bands is chosen, the following Colour Coding options are enabled.
Colour Set
Colour code the display by selecting an existing colour set or by defining a new one. Colours are assigned to each cell or pixel according to their value. Although this method is most applicable to grids it may also be used on images if necessary.
Colour sets are one of the most important ways of making it easy to differentiate between values, regions and other objects in the display. The tools you use to create colour sets are particularly powerful. Because colour sets are saved as form sets they can be used anywhere in a project and can even be exported to other projects.
To create a new colour set, right-click in the Colour set box to open the Numeric colour set dialog box. Here you can define a numeric colour set to control the colouring of the contour grid. The Assign and Calculate functions work for (binary) grid files. After you click Assign, make sure you select GRID as the file type. The Value prompt will be disabled and the cell values will be used for the ranges.
Default Colour
Select a different default colour by double-clicking (using the left mouse button) on the Default colour box. This is used if you do not define a colour set.
Transparent Colour
Double-click on the Colour icon to set a colour as transparent. This makes it possible, for example, to set as transparent the black (or white) border that surrounds a scanned map or an aerial photo.
This transparency is honoured in the Plot Editor when you plot an image. Note however that compressed image formats (like JPEG 2000, ECW, or MrSID) may be prone to “artifacting” (unwanted pixelisation or strange halos in areas of solid colour).
Tolerance
You can use the Tolerance setting to control the extent of the colour transparency.
The best tolerance depends on the image. A smaller tolerance may be suitable if the image is of high quality and is uncompressed, or compressed using a lossless method. A larger tolerance is needed for lossy compression formats like ECW, SID, JPG, or JP2 because the compression process always degrades areas that should contain the same pixel brightness values.
Powers of two are suitable values for an initial tolerance. Tolerances of 4 or 8 are typically used for high quality uncompressed images, whereas tolerances of 16 or 32 may be necessary for compressed images. Once an initial tolerance is found it may be refined by choosing an integer value near the chosen power of two. It may be impossible to find a suitable tolerance for highly compressed low-quality images, since the noise in these images often exceeds the range of the actual image data. Choosing too large a tolerance in this situation will erode actual image data without fully removing the surrounding to-be-transparent area.