Plot Editor Ribbon
Use the options provided on the Plot Editor ribbon to:
- Toggle the display of the Plot Frames pane, the Plot Forms pane, and the Properties Window.
- Zoom and Pan the Plot Editor window.
- Add new frames and labels to the plot layout.
- Save or Print the plot layout.
|
|
Click the Save button to save any changes you have made to the current layout. See: Saving a plot layout |
|
|
Click the Save As button to save a copy of the open file with a new name. |
|
|
Click the Export Plot button to export the current plot to an image or CAD/GIS format. See Export. |
|
|
Click the Save As Template button to export the plot document as a plot template file. |
|
|
Click the Apply Template button to import content from a plot template file to the current plot document. |
|
|
Click the Print button to print the current layout. |
|
|
Click the Save to PDF button to print the current plot layout to a PDF file. See: Save to PDF |
|
|
Click the New Frame tool to add a new frame to the layout. You can then click and drag the mouse in the layout window to define its size and position. When you release the mouse button, you will be prompted to select a frame type. |
|
|
Click the Pan Data in Frame tool to pan the data in the current plot frame by clicking and dragging the left mouse button. |
|
|
Click the Forms Pane button to toggle the display of the Plot Forms pane on and off. |
|
|
Click the Frames Pane button to toggle the display of the Plot Frames pane on and off. |
|
|
Click the Properties Pane button to toggle the display of the Properties Window on and off. |
|
|
Click the Select tool to Interactively select frames. To select multiple frames, hold down the CTRL key as you select them with the mouse. Use SHIFT to restrict the selection to the parent frame. |
|
|
Click the Pan tool to pan the plot layout window by clicking and dragging the left mouse button. To Zoom in and out on the layout window, hold down the CTRL key as you click and drag the left mouse button. You can also Interactively move and copy frames. |
| To Rotate the view (Vizex plot frames only) hold down the SHIFT key as you click and drag the left mouse button. | |
|
|
Click the Zoom tool to click and drag the mouse to define a zoom box. Alternatively, click the mouse once to zoom in with the cursor location as the new centre. |
| To Zoom out, hold down the CTRL key as you click or drag the mouse. If a zoom box is used, the display zooms to fit the current display into the zoom box. There are also Undo and Redo zoom buttons. | |
| To Zoom to a predefined zoom extent, click the Zoom 100% button (see below) or select another option from the Zoom menu: | |
| To Zoom in and out on the plot frame, hold down the CTRL key as you click and drag the left mouse button. | |
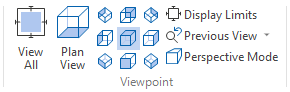
| The following viewpoint options are only available when a Vizex plot frame is selected in the layout: | |
|
|
Select Plan , Looking Up, Looking East , Looking West, Looking North or Looking South to define an orthogonal view of your Vizex plot data. |
|
|
| You can also use the L, R or T shortcut keys to Look East, West or in Plan. | |
|
|
Select Looking SW, NW, NE or SE to set the 3D camera to a preset isometric view. |
|
|
|
|
|
Click the Previous View button to undo the last zoom. |
|
|
Click the Next View button to redo the last Previous View operation. |
|
|
Use the Align Left button to align the object selected in the plot window to the left within its frame. |
|
|
Click Align Centre to horizontally centre align the object selected in the plot window within its frame. |
|
|
The Align Right button will align the selected object in the plot window to the right within its frame. |
|
|
The Align Top button aligns the object selected in the plot window to the top of the frame it is in. |
|
|
Click the Align Middle button to vertically centre align the object selected in the plot window relative to the frame it is in. |
|
|
The Align Bottom button aligns the object selected in the plot window to the bottom of the frame it is in. |
|
|
Click the Equal Size button to make the selected frames the same size. |
|
|
Use the Equal Width button to set the width of selected frames to the same value. |
|
|
The Equal Height button will adjust the vertical size of the selected frames to the same value. |
|
|
Clicking the Distribute Horizontally button will evenly space the selected frames within the window. |
|
|
Click the Distribute Vertically button to evenly space the selected frames within the window. |
|
|
The Show Rulers button toggles the display of rulers on the horizontal and vertical axes of the plot window. |
|
|
The Edit Labels button enables the Annotation tools for the selected frame. |
|
|
The Create/Edit Set button opens the Annotation Set form from which you can configure Dimensions and Labels for annotations. See: Annotation. |
| The Set drop down is used to select a saved annotation set to use with the open plot file. | |
|
|
The Format Picker lets you select the format settings from an existing annotation to be applied to a new annotation. |
|
|
The Format Painter lets you apply the format selected with the Format Picker to an annotation object you select. |
|
|
The Snap To Point button will snap the cursor to the nearest point in the frame. |
|
|
The Add Horizontal Line button adds a horizontal dimension line to the annotations. |
|
|
The Add Vertical Line button adds a vertical dimension line to the annotations. |
|
|
The Add General Line button adds a general dimension line to the annotations. |
|
|
The Add Measure Angle button enables an interactive tool that allows you to add an angle measurement to the annotations. |
|
|
Click the Add Arrow button to add an arrow icon to the annotations. |
|
|
Click the Add Text button to add a free text object to the annotations. |
|
|
The Add Callout button will add a text callout object to the annotations. |

|
The Add Text Box button will add a text box object to the annotations. |
|
|
The Edit Text button will place the selected text object in edit mode, so that text can be entered or changed. |
|
|
Click the Zoom 100% button to zoom to the actual size of the layout. Actual size is an on-screen approximation of the page size. Other zoom options are available via the Zoom tool menu (See above). |
|
|
The One Page button zooms the plot window view to the full page extents. |
|
|
Click the Page Width button to zoom the plot window to the page width extents. |