Generate Vizex Plot
![]()
When you generate a Vizex plot the whole scene is rendered as an image and at the same resolution supported by the printer. So for an A0 plot at 600 dpi, for example, an image that is roughly 30,000 x 20,000 pixels is generated which uses about 2GB of memory.
It makes absolutely no difference what is loaded in Vizex: a blank screen or a collection of large block models and wireframes will both create an image exactly the same size to send to the printer.
A scene with a few strings might only be a few hundred bytes as a 2D plot, but will be 2 gigabytes as a Vizex plot. Generating a Vizex plot is like generating a 2D plot with the Plot as image check box selected. However, in this case the image is generated automatically to match the size and the resolution of the printer page, and is not saved to disk.
To generate a Vizex plot:
Specify the following parameters in the Generate Vizex Plot form:
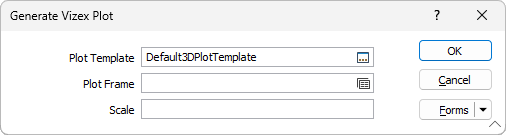
Plot Template
Double-click (or click on the Select icon) to select a plot template. The application provides a number of predefined standard layouts you can use as the basis for your plots. When you select a template, a Plot Layout (.PEX) file is generated.
If no template is selected, a default template will be used to generate a PEX file.
Plot Frame
Optionally, enter (or double-click or click on the Forms icon to select) an alternative form set which will be used to override the master plot frame in the template. If it is left blank then the plot frame in the template is used. If the master plot frame in the template is not a Vizex plot frame then a default Vizex plot frame will be used.
Scale
Enter the X and Y scale of the plot. If no scale is specified, the scale of the live or saved Vizex view will be applied in the plot frame.
Rotating the plot
To rotate the plot interactively in 3D:
- Click anywhere in the Vizex Plot frame to select it. Its border should be highlighted in red.
- Click the Pan Data Within Frame button.
- Hold the Shift key and drag the mouse within the frame to rotate the data.
- Hold the Ctrl key and drag the mouse within the frame to zoom the data.
Whenever you re-open a previously saved Vizex Plot it draws its information from the Saved View, not the position of the data when you saved the plot. To permanently change the orientation or position of the data, you must change the Saved View.
Saving the plot
You can save the plot layout as an XML-based Plot Editor Document (*.PEX) plot file.
If a grid is displayed in Vizex, then it will also be displayed in the Vizex plot frame as a part of the Vizex plot. While you can add a grid as a child of the Vizex plot frame, it will only display if an Orthogonal projection is used.
For information about how font sizes are rendered in a plot, refer to the Plot Font Size topic.