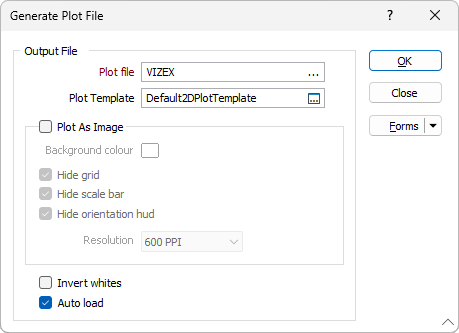
Generate Plot File
![]()
Specify the following parameters in the Generate Plot File form:
Output file
Plot file
Enter or double-click (F3) to select the name of the Plot file (.PEL) that will be generated.
Plot Template
Double-click (or click on the Select icon) to select a plot template. The application provides a number of predefined standard layouts you can use as the basis for your plots. When you select a template, a Plot Layout (.PEX) file is generated.
If no template is selected, only the PEL file is generated. However, if the Auto load option is selected, a default template will be used to generate a PEX file.
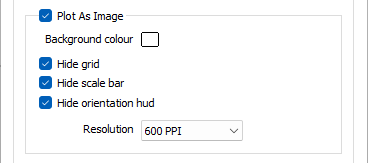
Plot as Image
To generate an image of the display, select the Plot as Image option. The following files are saved to the current project folder:
- A JPEG (.JPG) image file
- A georeference (.GRF) file
- If the view is in Plan, a MapInfo TAB file and a World file.
Background colour
When you create an image, you can set the background colour and choose a resolution for the file. The image will be produced in 24 bit colour.
A Note on transparency
2D Plots do not support transparency because it is not supported by the technology used - all the way down to the printer and/or the PDF file. In explanation, consider the following details:
When generating a plot and requiring transparency, the elements being drawn need to be "placed" in layers on the page together. This cannot be achieved on a printer; once the ink is printed for a black line, a "transparent" element cannot be placed above it to change the colour of the line. A plot is an additive surface - ink cannot be subtracted from paper.
A method of working around this problem is to compose the plot elements before plotting, capture this in an image and then print. This is commonly called a WYSIWYG (What You See Is What You Get). The Plot As Image and the live Vizex Plot are both forms of this method.
The downside of the 'workaround' is that the plot elements are now one static image composed from the presentation and can no longer be edited. The benefit of the 2D Plot is that the plot elements are stored as such and can be edited in that form- strings, points, filled polygons, hatches, text, symbols etc.
As the data starts in 3D inside Vizex, there is still a conversion from complex 3D Vizex data representations to "generic" 2D drawing elements. This means some of the complexity of the data is lost when it is simplified and reduced to 2D. Plotting to a 3D PDF attempts to keep the 3D data as long as possible, but the data still needs to be simplified to fit into a 3D PDF plot element.
There are several plotting options, each with distinct advantages and disadvantages. No method is the one true perfect method in every case. Understanding the differences can help to use the most appropriate method for the user.
Resolution
A 300 dpi image will be around 7MB in size. For screen display, 72 dpi is generally fine. To produce bitmaps suitable for advertising material and inclusion in reports, 300 dpi is generally a good resolution. If you have chosen to create an image with a very high resolution, it may take a few moments to create.
On the Vizex tab, in the Capture group, you can generate an image of the display by selecting Generate Screenshot. In this case, the name, location, and format of the image file can be selected.
Hide
Use the check box options provided to show or hide the reference grid, the scale bar and orientation arrows. These options are selected (hidden) by default.
Invert whites
Select this option to invert white polylines and their associated labels. This is useful when working with white polylines on a dark background in Vizex. Note: This option is unavailable when the Plot as Image check box is selected.
Auto Load
Select this option to automatically load the displayed data in the Plot Editor window. The plot will be opened using the selected template or (if blank) a default template. You can then edit the layout to suit your requirements.
When you run the VXPLOT macro, a form set can be selected in order to generate a .PEX file with a selected template. If the form set parameter is left blank, the Auto Load and the Plot As Image options are set to false and the template name is blanked (only a PEL file is generated).