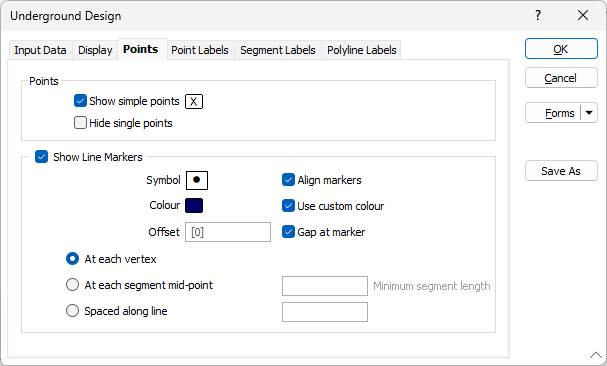
Points
Show simple points
Select this option if you want the points along a string to be visible. Optionally double-click the Colour icon to select a display colour for the string points.
Hide single points
Select this option if you want to hide single points in the display and exclude them from any plots generated from the display.
The Show Points option only affects the points along a string and has no effect on single points.
Show Line Markers
Select this check box to draw symbols at specified points along the lines. Double-click on the icons to select a symbol and a colour for the markers.
Line direction icons are enabled for this Vizex layer by default. Direction arrows are a scaled 2m in size.
Align markers
Select this check box to align the markers so that they match the orientation of the line.
Use custom colour
Select this check box to apply a custom colour to the line markers. If this check box is NOT selected, the Colour box is disabled and the colour of the line markers will match the line colour that is set in the Colour Coding group on the Display tab of the form. This is useful when the line work is colour-coded and the marker colours need to match the line colour.
Gap at marker
Select this check box to show a gap in the line at the position of each marker.
Offset
To offset the markers rather than position them on the line, specify an offset value in grid units.
You can choose to position the markers:
- at each vertex
- at each segment mid-point with an optional Minimum segment length.
- spaced along the line at a specified distance
Note: The value entered for Minimum segment length for line markers will prevent direction arrows from appearing on short segments, which can clutter the view.
