Structures
On the Structures tab of the Stereonet Graph form, you can choose to show:
- Planar structures, including the poles of the planes
- The mean pole and the mean plane
- Linear structures, and,
- Mean lineation
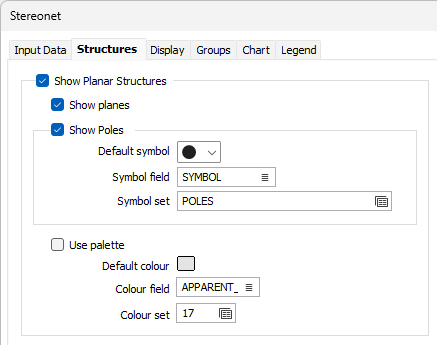
Show Planar Structures
Select this check box to show planes and poles on the graph. A number of point display options are then enabled.
Show planes
Select this check box (or select the same option on the Stereonet ribbon) to show the planes that intersect the spherical projection.
![]()
Show poles
Select this check box to show the poles of the planes on the Stereonet graph (or select the Show Points option on the Stereonet ribbon).
![]()
Each pole may be denoted by a marker Symbol. A range of standard (Circle, Square, Diamond, Pentagon, Hexagon, Star, Triangle, Plus, Cross) marker symbols are available for selection in a drop-down list.
Symbol field
Enter the name of the field (in the file) containing the data that will control which symbol is displayed.
Symbol set
Select the Symbol Set that is associated with the Symbol field. This set maps symbols to text strings or numeric ranges. For each record in the file, the symbol is determined by the value in this field.
Use palette
Select the Use Palette check box to apply the palette colours you have selected on the Chart tab. Alternatively, to apply standard colour-coding to the points on the graph, select a Colour field and a Colour Set.
Default colour
Double-click (F3) to select the colour that will be used when a Colour field or a Colour set is not defined - or when a value in the Colour field is either not valid or is not mapped in the Colour set.
Colour field
Specify the name of a field which contains the values that will be used with a Colour set to colour-code the display.
Colour set
To map values in the Colour field to the colour values in a Colour set, double click (F3) to select the set that will be used to control the display colour. Right-click (F4) to create or edit a Colour set.
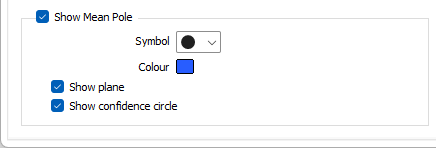
Show Mean Pole
Select this check box (or select the same option on the Stereonet ribbon) to show the Mean Pole of the planes on the graph. Note that this option is independent of the Show poles check box selection.
![]()
The Mean Pole can be denoted by a marker Symbol and a display Colour. A range of standard (Circle, Square, Diamond, Pentagon, Hexagon, Star, Triangle, Plus, Cross) marker symbols are available for selection in a drop-down list.
Show plane
Select this check box to show the Mean Plane on the graph. Note that this option is independent of the Show planes check box selection.
Show confidence circle
Select this check box to show a Confidence circle on the graph.
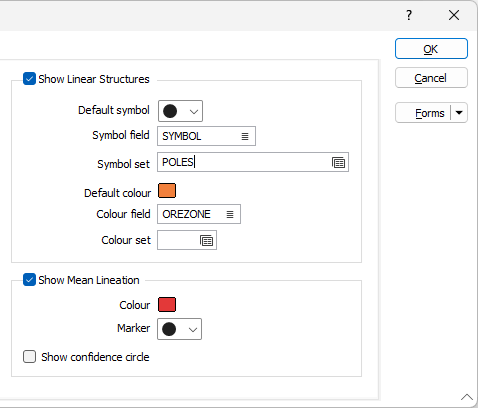
Show Linear Structures
Select this check box to show lineations on the graph.
Lineation points are denoted by a marker Symbol and may be colour-coded. A range of standard (Circle, Square, Diamond, Pentagon, Hexagon, Star, Triangle, Plus, Cross) marker symbols are available for selection in a drop-down list.
Symbol field
Enter the name of the field (in the file) containing the data that will control which symbol is displayed.
Symbol set
Select the Symbol Set that is associated with the Symbol field. This set maps symbols to text strings or numeric ranges. For each record in the file, the symbol is determined by the value in this field.
Default colour
Double-click (F3) to select the colour that will be used when a Colour field or a Colour set is not defined - or when a value in the Colour field is either not valid or is not mapped in the Colour set.
Colour field
Specify the name of a field which contains the values that will be used with a Colour set to colour-code the display.
Colour set
To map values in the Colour field to the colour values in a Colour set, double click (F3) to select the set that will be used to control the display colour. Right-click (F4) to create or edit a Colour set.
Show Mean Lineation
Select this check box to show the Mean of the lineations on the graph.
Note that this option is independent of the Show Linear Structures check box selection.
The Mean Lineation can be denoted by a Marker symbol and a display Colour. A range of standard (Circle, Square, Diamond, Pentagon, Hexagon, Star, Triangle, Plus, Cross) marker symbols are available for selection in a drop-down list.
Show confidence circle
Select this check box to show a Confidence circle on the graph.