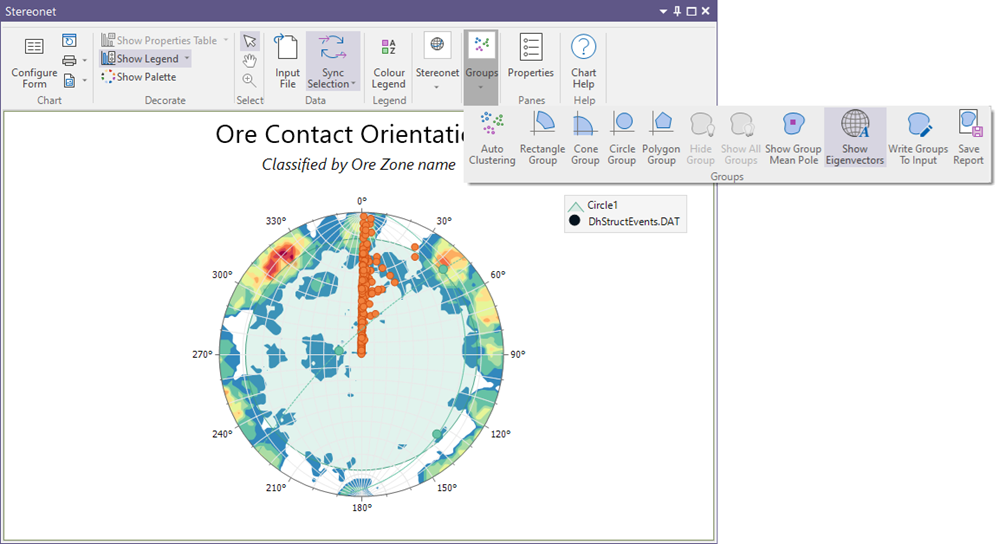
View the Stereonet
When you view and analyse a Stereonet display you can interactively identify groups of poles and calculate and display the mean vector orientation of selected structures.
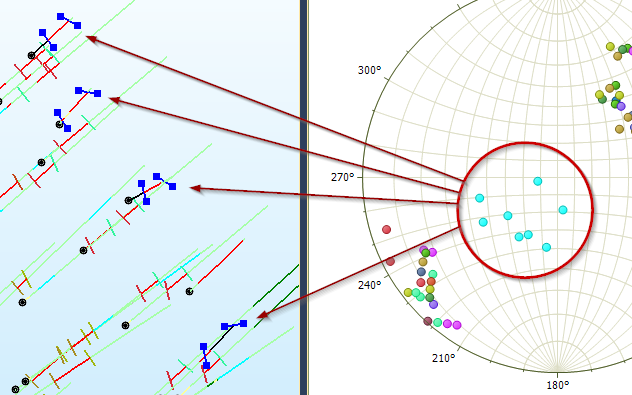
A Sync Selection option is available which allow you to highlight the corresponding data in Vizex and the File Editor.
When you generate a chart, many of the tools and options on the Chart ribbon are common to most charts. See: Chart Tools
Other tools on the Chart toolbar are specific to the type of chart displayed. In the Stereonet Chart, you can:
|
|
Show/hide the Poles on the Stereonet. |
|
|
Show/hide the Planes on the Stereonet. |
|
|
Show/hide the mean pole of the planes on the Stereonet. |
|
|
Under Grid Options, Show an Equatorial grid or a Polar grid, or do not show a grid. |
|
|
Under Display Mode, apply an Equal Angle projection or an Equal Area projection. |
|
|
Under Density Options, Contour the points according to their relative density, colour code each point according to the density of the points within its neighbourhood, or do not show the density of the data points. |
|
|
Under Distribution Options, use the Fisher distribution or use the Schmidt distribution to produce smoother contours of sparse data. |
|
|
Use the Auto Clustering option to open the Stereonet Auto Clustering form and automatically cluster points in the Stereonet based on their density. |
|
|
Click the Rectangle Group tool to group poles by digitising a two-point rectangle. |
|
|
Click the Cone Group tool to group poles by plunge value. |
|
|
Click the Circle Group tool to group poles by digitising a circle. |
|
|
Click the Polygon Group tool to group poles by digitising a multiple point polygon. |
|
|
Show/hide the corresponding Eigenvectors. |
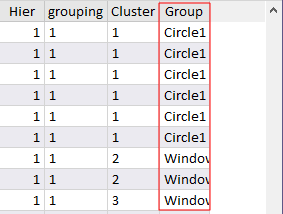
| The group windows you define using the Rectangle, Cone, Circle and Polygon tools are detailed on the Groups tab of the form. |
If Groups have been defined:
|
|
Hide the selected group. |
|
|
Show all hidden groups. |
|
|
Show/hide the mean pole of the planes for each group. |
|
|
Show/hide the corresponding Eigenvectors. |
|
|
Save group properties to a Stereonet report. |
|
|
Write group labels to the Input file. If a group has no label it will not be written to the file. |
|