Groups
On the Groups tab of the Stereonet Graph form, you can adjust the display of the groups you have defined using the interactive pole grouping tools on the Chart toolbar.
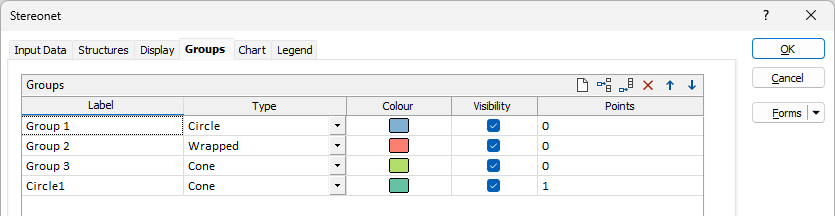
You can use the tools in the grid to Manage the rows in the list.
The Label field is used to enter the label for the group.
Use the Type drop down to select the Stereonet group type.

The Colour field is used to select the display colour for the group.
The Visiblity check box allows you to temporarily hide a group so that the data within the group can be selected interactively. Note that hidden groups will be excluded when you export the stereonet display as an image.
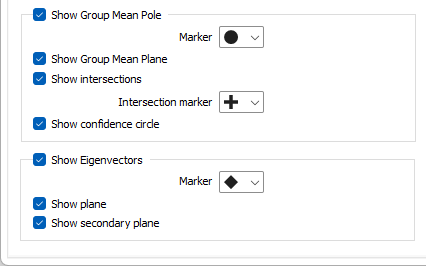
Show Group Mean Pole
Select this check box to show the mean pole of the planes for each group. Note that this option is independent of the Show poles check box selection on the Display tab.
The mean pole can be denoted by a Marker symbol. A range of standard (Circle, Square, Diamond, Triangle, Pentagon, Hexagon, Star) marker symbols are available for selection in a drop-down list.
Show Group Mean Plane
Select this check box to show the mean plane of each group. Note that this option is independent of the Show planes check box selection on the Display Options tab.
Show intersections
Select this check box to display the intersections of each group.
The intersections can be denoted by a Marker symbol. A range of standard (Circle, Square, Diamond, Triangle, Pentagon, Hexagon, Star) marker symbols are available for selection in a drop down list.
Show confidence circle
Select this check box to show a Confidence circle on the graph for each group.
Show Eigenvectors
The application calculates eigenvalues and eigenvectors when it determines the mean orientation of each group. You can optionally select this check box to display the corresponding eigenvectors on the stereonet. Clicking on an eigenvector will display its orientation and its associated eigenvalue in the Properties window. The eigenvalues may then help you to understand the directional distribution of poles within each group:
- When Axis 1’s eigenvalue is much greater than the other two axes, the poles are concentrated into a single area.
- When Axis 1 and 2 have about the same eigenvalue, the poles are distributed around a great circle.
- When all three axes have about the same eigenvalue, the poles are uniformly distributed.
Eigenvectors can be denoted by a Marker symbol and a display Colour. A range of standard (Circle, Square, Diamond, Triangle, Pentagon, Hexagon, Star) marker symbols are available for selection in a drop-down list.
Show plane and Show secondary plane
Select this check box to show the plane that contains the Axis 2 and Axis 3 eigenvectors. This option is different to the Show planes check box on the Display tab. You can also choose to display the secondary plane that contains the Axis 1 and Axis 2 eigenvectors.
Show Mean Lineation
Select this check box to show the mean lineation of the planes for each group.
The mean lineation can be denoted by a Marker symbol. A range of standard marker symbols are available for selection from the drop down list.
Show confidence circle
Select this check box to show a lineation Confidence circle on the graph for each group.
