Gantt Chart
![]()
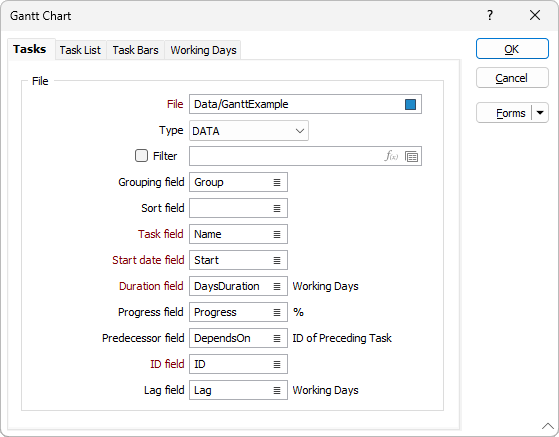
Tasks
File
On the Tasks tab of the Gantt Chart form, select a file type and then enter (or double-click or click on the Select icon to select) the name of the Source file. If the file does not exist, a new file will be created with the necessary fields.
Note that the Gantt Chart will only show the first 100 tasks in the file
Grouping field
A group will be created for each unique value in this field and each task will be assigned to their corresponding group.
Sort field
Tasks are sorted according to the values in this field. Each group is sorted independently.
Task field
The field containing the name of each task.
Start date field
The field containing the start date of each task. The field must be a Date field.
Duration field
The field containing the duration of the task in working days.
Progress field
This field should contain values between 0 and 100, to indicate the completion percentage of each task.
Predecessor field
The field containing the ID of the task that each task depends on (see ID field below).
ID field
The field containing a list of unique ID values, used in the Predecessor field (see above).
Lag field
When auto adjusting the tasks start dates to ensure dependencies are correct, the Lag field is used to indicate how many working days of lag there are before a task is started. This value can be negative, which will cause an overlap of connected tasks.
When you generate the chart, tasks can be interactively moved by clicking and dragging with the mouse. Tasks may also be stretched by dragging the right edge of a task bar. Tasks will be automatically adjusted to satisfy dependencies. Moving a task forward, for instance, will also move its dependent tasks. A task's lag will be updated when you move a task that is dependent on another. If no Lag field is defined, you will be unable to move tasks that depend on other tasks.