H-Scattergram
![]()
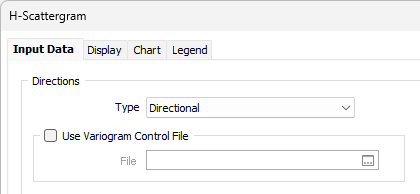
Directions
The selection of an Input Direction type allows you to switch between Directional (the default) and Omnidirectional variograms.
Type
| Direction | Description |
|---|---|
|
Directional |
Directional semi variograms are used to measure the degree of spatial continuity in a particular direction through a data set. |
|
Omnidirectional |
Omnidirectional semi variograms are used for investigating the degree of spatial continuity in a dataset by searching for data pairs in all directions through the dataset. |
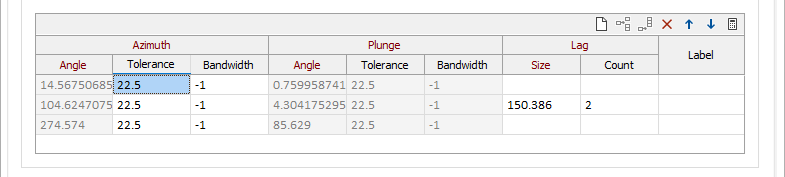
When you select Directional as the Input direction, the following Semi Variogram Direction parameters are enabled in the Directions grid:
Azimuth Angle
Each row in the table describes the characteristics of a directional search. For each azimuth, the plunge, interval length and number of intervals must be defined. The azimuth must be a value between 0 and 360°. Only whole degrees can be entered. Angles are measured clockwise from North.
Azimuth Tolerance
Tolerance is optional and will default to 10 if blank, and the Interval Count will be set to fit the max pair separation
You must also specify a tolerance for the azimuth. The tolerance will be added to and subtracted from the azimuth you specify. Data that falls within the volume defined by the tolerance will be included in the calculation. Entries with up to one decimal place can be entered.
Azimuth 2x Bandwidth
This field is used to define a distance in metres which is the maximum width of the cone or prism, as defined by the tolerance setting that is applied to the azimuth of a search direction.
Plunge Angle
Enter the plunge for which a calculation will be made. In this case downward values are positive (+Plunge = Down). The plunge must be measured from the horizontal (0) in the plane of the azimuth. Only whole degrees can be entered.
If a Z field is not defined then the Plunge, Plunge Tolerance and Bandwith options are disabled.
Plunge Tolerance
You must also specify a tolerance for the plunge angle. The tolerance will be added to and subtracted from the plunge you specify. Data that falls within the volume defined by the tolerance will be included in the calculation. Entries can have up to one decimal place.
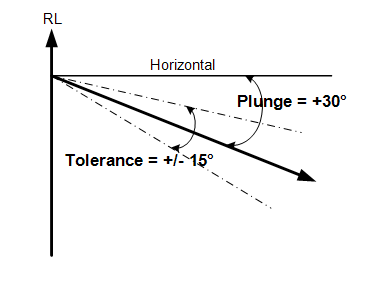
In this case, plunge values are positive down and the horizontal = 0. Leave the plunge at 0 when two dimensional calculations are being performed, that is, a Z variable has not been specified.
Plunge 2x Bandwidth
This field is used to define a distance in metres which is the maximum width of the cone or prism, as defined by the tolerance setting applied to the plunge of a search direction
When 2D semi variograms are specified (by not defining a Z field in the Semi Variograms form) the Plunge group will be disabled.
Lag Interval and Number of Intervals
If the number on intervals is unspecified, it will be set to fit the maximum pair separation.
You need to define the interval size and the number of intervals to control which values the semi-variogram calculation will use. In geostatistics the Interval is called a Lag.
Directional and omnidirectional semi variograms group samples into distance intervals. Pairs of samples at distances equal to the product of the interval number and the interval, plus or minus half the interval size, are included in the calculation for a search volume.
The maximum distance covered in the search for values is the product of the Interval size and the number of Intervals. Generally, this distance is approximately half of the sample coordinate range for a particular direction.
![]() An auto-calculate button can be used to calculate appropriate Size and Count parameter values.
An auto-calculate button can be used to calculate appropriate Size and Count parameter values.
Use Variogram Control File
A Variogram Control File can be saved on the Chart | Variograms tab once a Variogram Map or Variograms Chart has been calculated, and provides a way of passing variogram information between different Variography functions or any function that need to reference a semi variogram as part of its modelling parameters.
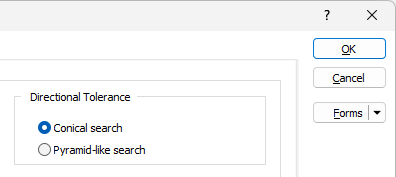
Direction Tolerance
Choose whether a Conical or a Pyramid-like volume will be used to search for the data to be used in the semi variogram calculations. The Direction Tolerance is defined by this setting and the tolerance settings for the Azimuth and Plunge of a search direction.
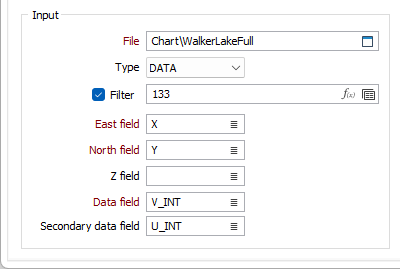
Input
File
Enter the name and type of the file containing semi variogram data.
Filter
Select the Filter check box if you want to apply a filter to the data in the file. Enter a filter number in the adjacent response. Double click (F3) to see a list of existing filters. Right click (F4) to open the dialog box to create a new filter or edit an existing filter.
East, North, Z fields
Double-click (or click on the select icon) to select the fields that contain Easting , Northing and (optional) Z coordinates.
Data field
Enter (or double-click to select) the name of the field that contains the data to be plotted.
Secondary data field
To support cross h-scatter plots (which allow you to visualise the relationship between variables), enter (or double-click to select) the name of a secondary data field.
Note that default labels in charts often use the input field name to label the data being plotted. If these fields are expressions, then the expressions will be used as the label text. To avoid this, you can use an additional attribute to define the label. See: Output Field Name Attributes
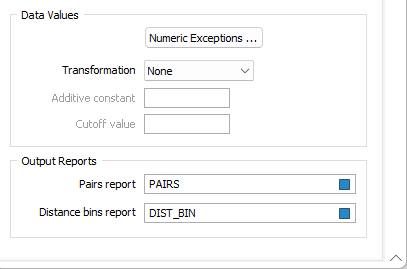
Data Values
Use the Data Values group to apply a data transformation. Aside from not altering the data at all, the most commonly used transformations are NATURAL LOG and INDICATOR. See: Transformation
Numeric Exceptions
(Optionally) Use the Numeric Exceptions group to control the way that non-numeric values are handled. Non-numeric values include characters, blanks, and values preceded by a less than sign (<).
Transformation
When the Input mode is Calculate, you have the option to apply a data transformation.
Aside from not altering the data at all, the most commonly-used transformations are NATURAL LOG and INDICATOR. See: Transformation
Additive constant
This input will be enabled if you have set Transformation to NATURAL LOG.
An additive constant can be used with a natural log transformation to force data which is near log normal to take on a log normal distribution. Since the additive constant is added to all values, it has the effect of increasing the Natural log of small values relatively more than large values; in effect rotating the graph of the natural logs of the data value to the right.
Cutoff value
This input will be enabled if you have set Transformation to INDICATOR. Enter the value of the indicator to be used when using an Indicator transformation.
Output Reports
Optionally, enter (double-click, or click on the Select icon to select) the name of a Pairs report and Distance Bins report files to which the results of the process will be written.
The Pairs report lists each pair and the distance between them. The Distance bins report lists these statistics for each distance bin.