Display
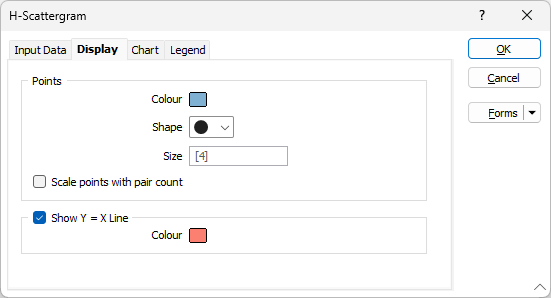
On the Display tab of the H-Scattergram form, set a marker symbol, a point size, and a colour for the displayed data points. You can choose to scale the points based on binned pairs and also choose whether to display a line indicating where the two distributions are exactly equal.
Points
Double click (F3) to select a colour for the displayed points.
Shape
Select a shape for the displayed points. A range of standard (Circle, Square, Diamond, Pentagon, Hexagon, Star, Triangle, Plus, Cross) marker symbols are available for selection in a drop-down list.
Size
Enter a point size or accept the default. The point size defines the radius of the points.
Scale points with pair count
In the H-Scattergram display, the pairs are binned into a gridded layout. If this option is enabled, each point scales in accordance with the amount of pairs binned into it. Smaller points will be drawn in front of the larger points
Show Y = X line
Enable Show Y = X Line to display a line indicating where the two distributions are exactly equal. The nearer your data is to this line, the better the match between the two distributions.
If this option is selected, double-click to select the colour that will be used to depict the line.