Chart Presentation Layout
![]()
Note that the charts you create are non-interactive copies of the charts created using other charting form sets. They cannot be edited, and reports cannot be generated.
Charts
Select from a list of chart form sets. Use the buttons on the local toolbar to Manage the rows in the list.
Chart
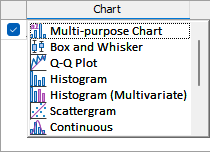
Select a chart type. You can use the check boxes on each row of the grid to include or exclude a chart from the presentation.
Note that a Ternary Diagram cannot be shown in a Chart Presentation Layout.
Form set
Select a chart form set of the type you have selected.
Title
This input is enabled if you have chosen to enter a user-defined title for each chart. See: Graph Titles below.
Column/Row
This input is enabled if you have chosen a Column-wise or a Row-wise custom layout. See: Layout below.
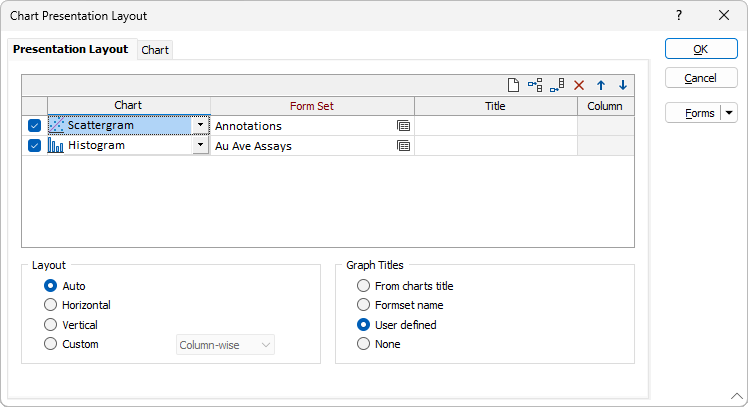
Layout
Choose an (Auto, Horizontal, Vertical, Custom) presentation layout:
| Option | Description |
|---|---|
| Auto | A best-fit is calculated. |
| Horizontal | The charts are aligned horizontally. |
| Vertical | The charts are aligned vertically. |
| Custom | Choose between a Column-wise or a Row-wise layout. This will enable the specification of a Column number or a Row number, respectively, for each chart listed in the Charts grid. The numbers you enter will determine the display sequence of the charts. |
| To show more than one chart in the same column or row, enter the same column or row number for those charts. |
Graph Titles
A chart may comprise one or more graphs, Choose how the titles of the graphs on each chart are derived. By default, the titles on the graphs of the original charts are used. As an alternative you can:
- Choose to use the form set name as the title of each chart.
- Enter a user-defined title for each chart listed in the Charts grid.
- Select None if you do not want to add titles to the charts.
Label, theme and image generation settings can be configured on the Chart tab.
OK
Click OK to launch the presentation window.
Forms
Click the Forms button to select and open a saved form set, or if a form set has been loaded, save the current form set.
By design, the Forms button is not available for loaded Vizex layers (i.e. when opening the form set properties of a layer in the Vizex Layer Display pane). In Vizex, the Forms button is only available for new forms opened via the Home tab or the Vizex tab, in the Layer group (or by double-clicking on a form type node in the Vizex Layer Types pane).
Save and Save As
Click the Save button to save the changes you have made to the form set. Click Save As to save your changes as a new form set. Save As will default to the first available form set number.
Reset
Click Reset to clear the form of all values and reset the form to its default state.
Reset Tab
For tabbed forms, select Reset Tab to clear the active tab of all values and reset the tab to its default state - without making any changes to other tabs in the dialog.
Undo and Redo
Click Undo (CTRL + Z) to undo recent changes in the form. After an Undo, click Redo (CTRL + Y) to restore the last change that was undone.
Collapse
Collapse (roll-up) the form to preview a chart, or preview the results of an operation in Vizex, or obtain input values from Vizex, the Property Window, the File Editor, or the Plot Editor.