Run
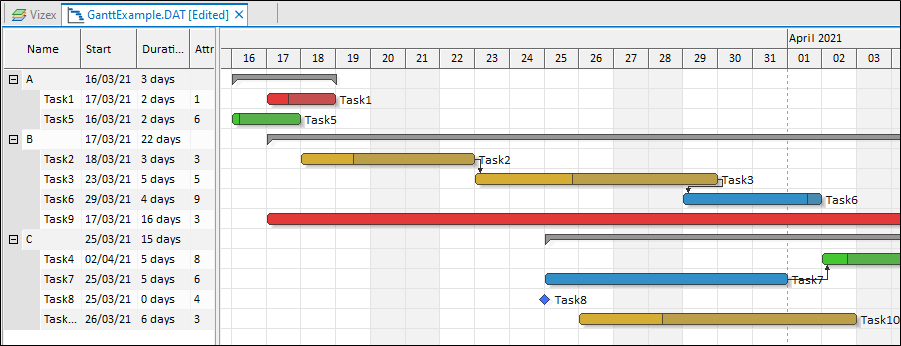
Note that the data in the Gantt Chart is a live view of the data in the underlying file. Changes to the file will be reflected in the chart, and vice versa.
When you generate the chart, tasks can be interactively moved by clicking and dragging with the mouse. Tasks may also be stretched by dragging the right edge of a task bar. Tasks will be automatically adjusted to satisfy dependencies. Moving a task forward, for instance, will also move its dependent tasks. A task's lag will be updated when you move a task that is dependent on another. If no Lag field is defined, you will be unable to move tasks that depend on other tasks.
On the application title bar, or the Quick Access Toolbar, click Undo (CTRL + Z) to undo the last edit. The Undo function records the edits you have made and will undo those edits in reverse order. Following an Undo, click Redo button (CTRL + Y) to re-apply the last edit.
When you generate a chart, many of the tools and options on the Chart ribbon are common to most charts. See: Chart Tools
Other tools on the Chart toolbar are specific to the type of chart displayed. In the Gantt Chart, you can:
| Button | Description |
|---|---|
|
|
Create: Create a new task. See: Create Task |
|
|
Delete: Delete the selected tasks (you can also press the Delete key). |
|
|
Auto Adjust: Adjust all task start dates to ensure that task dependencies and lags are satisfied and valid. |
|
|
Go to Start: Go to the earliest starting task. |
|
|
Go to End: Go to the latest ending task. |
|
|
Go to Today: Navigate the Gantt timeline to show today. |