Display
On the Display tab of the Top Cut form, set the (POINTS, LINE, POINTS + LINE) display mode of the Top Cut Chart, choose between single graph or multi-graph chart mode, and set other display options.
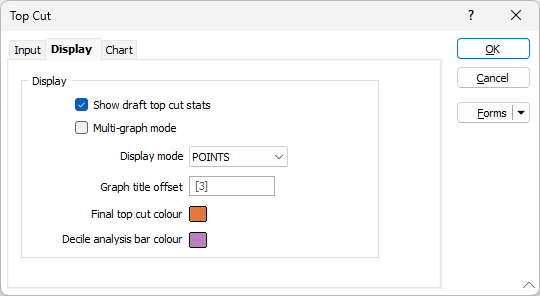
Show draft top cut stats
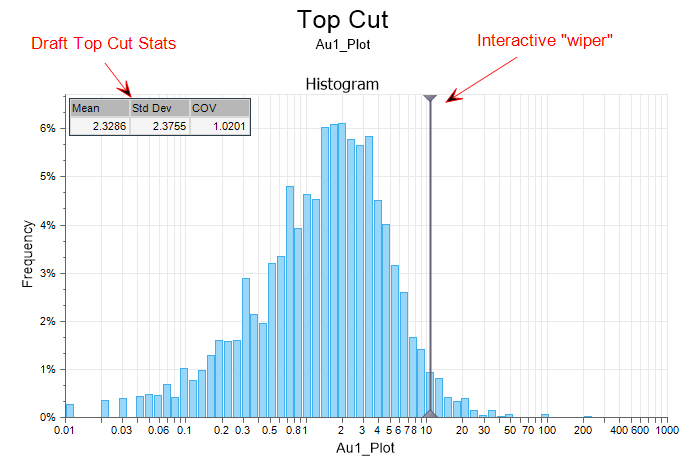
Select this check box to show (Mean, Std Dev, and COV) stats of the data that has been top cut using the draft top cut, on each graph.
The stats on each graph will change dynamically as the wiper is adjusted:
Multi-graph
Select this option to display the chart in Multi-graph rather than Single graph mode. You can also toggle between modes on the Chart tab when the chart is open.
![]()
Display Mode
Choose how the average grade values on the chart will be displayed (as POINTS, LINE, or POINTS + LINE).
Graph Title Offset
To offset the title text from each graph, specify an offset value or accept the default [3]. Offset units are "Character" widths, not grid units.
Final Top Cut Colour
If you have chosen to define a final top cut on the Input tab of the form, double-click to select a display colour for the Final Top Cut Line.
Decile Analysis Bar Colour
Double-click to select a display colour for the Decile Analysis Bar (if you have chosen to include a Decile Analysis Graph on the Input tab of the form).