Grade Tonnage Curve
![]()
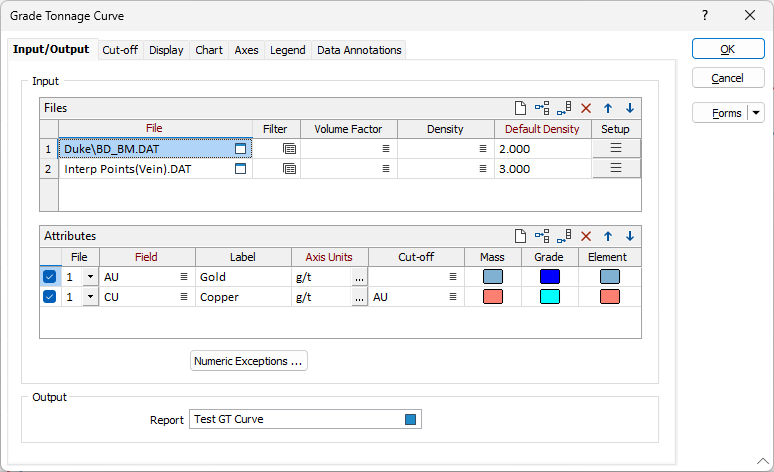
Input/Output
Files
In the Files grid, double-click (or click on the Select icon) to select the name of name of a data file containing one or more Grade fields and 3D coordinates.
You can optionally apply a filter to select a subset of the data in the file.
Multiple files can be added to the grid and configured as follows:
Volume factor field
(Optionally) Double-click to select a Volume factor field in the input file. The volume of each sample/block is factored by the value in this field.
Density field
(Optionally) Double-click to select a Density field in the input file. Density and Volume values are used to calculate the grade tonnage.
Default Density
Enter a Default Density value, expressed in tonnes per cubic metre (t/m3). Specific gravity values are also suitable for this purpose. If you have not specified a Density field, this value will be used for all records in the input file.
If you have specified a Density field, this value will be substituted where a Density value is missing from a record in the input file.
Note: If your project uses Imperial rather than Metric units, the form will prompt for a Tonnage factor field that contains the tonnage factor
The Default Tonnage factor should be expressed in the units specified on the Reported Values tab for Report tonnage factor > Units.
Setup
Click the list button to open the File Setup form for the data file:
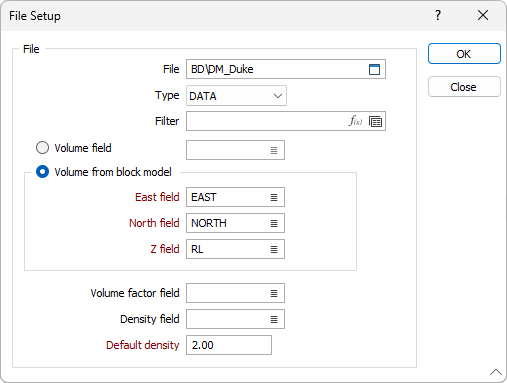
Volume
Choose how volume values will be obtained to calculate the grade tonnage:
- Volume field
- Volume from block model
Select this option to obtain volumes from a field in the input file. Double-click, or click on the List icon to select the field that contains the volume values.
Select this option to obtain volumes from the records for each point in the input file. Double-click, or click on the List icon to select the (East, North, Z) coordinate fields in the file.
Attributes
In the Attributes grid, the Grade Fields and related values for each data file in the Files grid can be configured.
File
Select the checkbox for the File to display the information for the row on the grade tonnage curve graph. Use the drop down to select the File for the row.
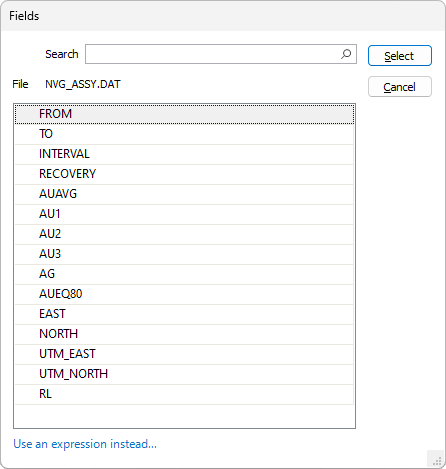
Field
On each row of the grid, double-click (or click on the Select icon) to select the name of a Grade field containing the values that will used for the analysis and plotted on the chart.
Label
Each grade field can be assigned a label.
Note that default labels in charts often use the input field name to label the data being plotted. If these fields are expressions, then the expressions will be used as the label text. To avoid this, you can use an additional attribute to define the label. See: Output Field Name Attributes
Axis Units
Each grade field can be assigned a grade unit which determines how the ore mass for each point is calculated. Grades are measured in the units selected here. Any units assigned to fields in the input file are ignored.
For Metric projects, densities are specified in t/m3. Tonnage is expressed in tonnes (t).
For Imperial projects, tonnage factors are specified in ft3/sh tn. Tonnage is expressed in short tons (sh tn).
See: Unit Conversions
Cut-off
Double click to select a cut-off grade for the Attribute row.
You can Use and expression instead... by clicking the link and using the Expression Editor.
Double-click to select a colour for the Mass, Grade and the Element.
Use the buttons on the local toolbar to Manage the rows in the list.
Numeric Exceptions
(Optionally) Use the Numeric Exceptions group to control the way that non-numeric values are handled. Non-numeric values include characters, blanks, and values preceded by a less than sign (<).
Output
Report
Enter (double-click or click on the Select icon) to select the name of the Report File that will be written as a result of the process. To see the contents of the file, right-click in the file box and select View (F8).
The Report Viewer is opened for any Statistical function that generates a Report file. Click the Form button on the Viewer toolbar to re-open the form, adjust the parameters of the Statistical calculation, and then choose to overwrite or append to the output in the Viewer window.
Forms
Click the Forms button to select and open a saved form set, or if a form set has been loaded, save the current form set.
By design, the Forms button is not available for loaded Vizex layers (i.e. when opening the form set properties of a layer in the Vizex Layer Display pane). In Vizex, the Forms button is only available for new forms opened via the Home tab or the Vizex tab, in the Layer group (or by double-clicking on a form type node in the Vizex Layer Types pane).
Save and Save As
Click the Save button to save the changes you have made to the form set. Click Save As to save your changes as a new form set. Save As will default to the first available form set number.
Reset
Click Reset to clear the form of all values and reset the form to its default state.
Reset Tab
For tabbed forms, select Reset Tab to clear the active tab of all values and reset the tab to its default state - without making any changes to other tabs in the dialog.
Undo and Redo
Click Undo (CTRL + Z) to undo recent changes in the form. After an Undo, click Redo (CTRL + Y) to restore the last change that was undone.
Collapse
Collapse (roll-up) the form to preview a chart, or preview the results of an operation in Vizex, or obtain input values from Vizex, the Property Window, the File Editor, or the Plot Editor.