Chart | Grade Tonnage
The Chart window comprises two parts: the Graph and the Properties Pane:
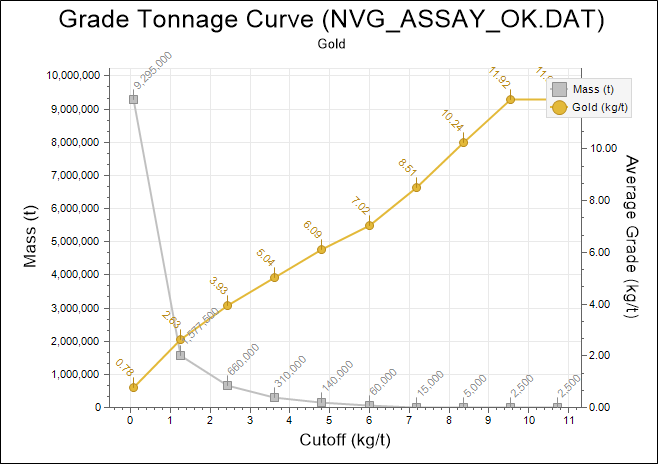
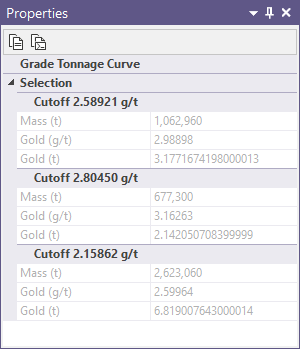
The average grade and field values for the current record are shown in the Properties Pane when you select a cutoff:
When you generate a chart, many of the tools and options on the Chart ribbon are common to most charts. See: Chart Tools
There are no tools specific to the Grade Tonnage Curve chart. To change the display mode, click the Form button to open the Output tab of the form associated with the chart.