Boundary Analysis
The boundary analysis works by generating spatial statistics of the domains under investigation, starting at the contact (zero distance) and binning the data at regular distance increments until the maximum distance is reached or there is no more data.
![]()
The binned data is displayed on a symmetric chart layout with one domain facing left and the other facing right. The domains are separated at the contact, which appears as a vertical line in the centre of the chart.
Drop-down lists in the chart toolbar provide quick changes when multiple domains share the contact.
Grade trends are shown as trendlines of average grade versus distance from the contact, and summary statistics are shown in the Properties window.
The nature of the contact is revealed by comparing the grade trends across the contact.
A large grade discontinuity indicates a hard or sharp boundary, and a small or no discontinuity indicates a soft or gradational boundary, and bar graphs show the level of sample support in each bin.
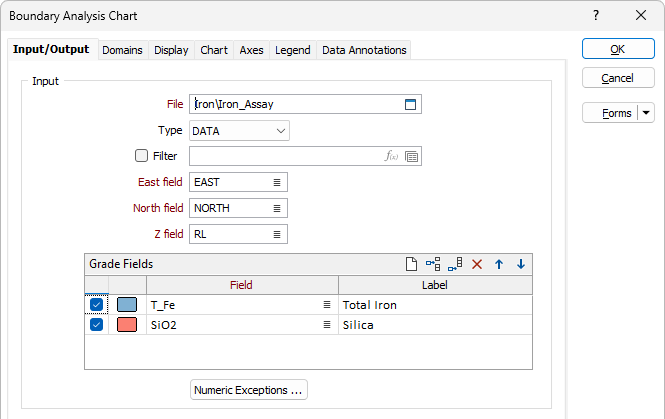
Input
File
On the Input tab of the Boundary Analysis form, select a file type and double-click (or click on the Select icon) to select the name of the file containing the source values. If required, define a filter to selectively control which records to process.
East, North, Z fields
Double-click (or click on the List icon) to select the fields containing the coordinates of the data you want to chart.
Grade Fields
Any number of grade fields may be used. On each row of the grid, double-click (or click on the Select icon) to select the name of a Grade field containing the values that will used for the analysis and plotted on the chart. Use the check boxes to choose which fields to include or exclude from the chart.
Note that default labels in charts often use the input field name to label the data being plotted. If these fields are expressions, then the expressions will be used as the label text. To avoid this, you can use an additional attribute to define the label. See: Output Field Name Attributes
Use the buttons on the local toolbar to Manage the rows in the list.
Numeric Exceptions
(Optionally) Use the Numeric Exceptions group to control the way that non-numeric values are handled. Non-numeric values include characters, blanks, and values preceded by a less than sign (<).
Config
The Config options control the bin count and the distance to be spanned.
Max Distance
Enter a maximum distance. Increasing the distance extends the reach of the analysis.
Bin count
Enter the number of bins. Increasing the count adds detail to the result.
Write Soft Boundary Weights
Select the check box to generate soft boundaries for the analysis by assigning weights to samples falling within the boundaries defined in the chart.
Weights are based on the distance of each point from the domain boundary, up to a maximum distance, as specified on Display tab. Weights of 1 are on the domain boundary, or within. Weights of 0 are at the maximum distance or more. In between are points that are close enough to the domain boundary, with their weight calculated using the interpolation method.
Interpolation method
Select the interpolation method for the soft boundary weight calculation - Linear or Exponential.
Use Linear interpolation where samples have relatively consistent distances, and use Exponential interpolation where samples exhibit a trend.
Report
File
Enter (double-click or click on the Select icon) to select the name of the Report File that will be written as a result of the process. To see the contents of the file, right-click in the file box and select View (F8).
The Report Viewer is opened for any Statistical function that generates a Report file. Click the Form button on the Viewer toolbar to re-open the form, adjust the parameters of the Statistical calculation, and then choose to overwrite or append to the output in the Viewer window.

Forms
Click the Forms button to select and open a saved form set, or if a form set has been loaded, save the current form set.
By design, the Forms button is not available for loaded Vizex layers (i.e. when opening the form set properties of a layer in the Vizex Layer Display pane). In Vizex, the Forms button is only available for new forms opened via the Home tab or the Vizex tab, in the Layer group (or by double-clicking on a form type node in the Vizex Layer Types pane).
Save and Save As
Click the Save button to save the changes you have made to the form set. Click Save As to save your changes as a new form set. Save As will default to the first available form set number.
Reset
Click Reset to clear the form of all values and reset the form to its default state.
Reset Tab
For tabbed forms, select Reset Tab to clear the active tab of all values and reset the tab to its default state - without making any changes to other tabs in the dialog.
Undo and Redo
Click Undo (CTRL + Z) to undo recent changes in the form. After an Undo, click Redo (CTRL + Y) to restore the last change that was undone.
Collapse
Collapse (roll-up) the form to preview a chart, or preview the results of an operation in Vizex, or obtain input values from Vizex, the Property Window, the File Editor, or the Plot Editor.