Domains
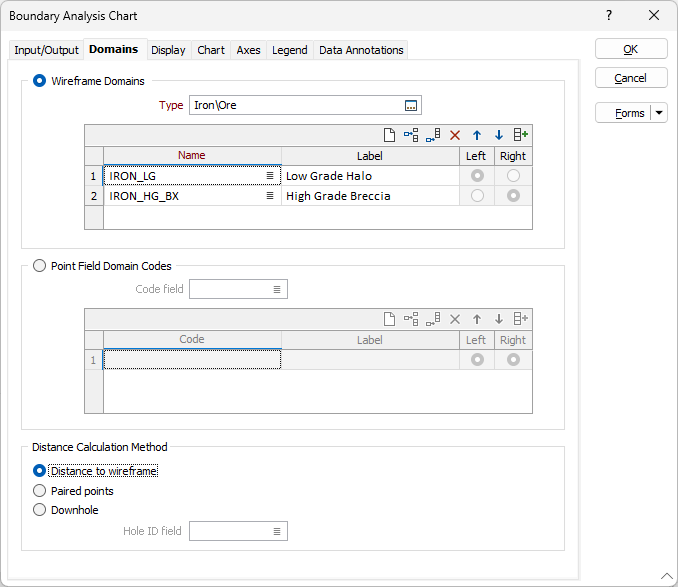
On the Domains tab of the Boundary Analysis form, choose how the domains will be modelled and displayed. The input domains may be represented by wireframe solids of the same triangulation type, or by point field data differentiated by geological code.
Wireframe Domains
Double-click or click on the Select icon to select a wireframe type. You can then select the input wireframes, or use the Autofill button in the grid to import names from a wireframe set.
For best results, the adjacent domain wireframes should be spatially close.
Left and Right
Use the buttons on the local toolbar to Manage the rows in the list.
Point Field Domain Codes
Double-click or click on the Select icon to select a Code field, then use the grid to select one or more Code values. The option to specify a label for each code is provided.
Left and Right
Use the buttons on the local toolbar to Manage the rows in the list.
Click the Autofill button to auto-fill the grid using the values in the nominated Code field.
Distance Calculation Method
Boundary analysis is performed using the distance calculation method you choose:
- For Wireframe Domains, the Distance to wireframe method will flag the drillholes or composites in the input file with their distance from one or more target wireframes. Since the distances from the wireframe are always normal to the surface, the orientation of the holes to their points of contact is not a factor in the analysis.
- The Paired Points method will flag the drillholes or composites in the input file based on the distance between paired points.
- The Downhole method will flag the drillholes or composites in the input file with their downhole distance based on each Hole ID and the interval lengths of the the specified Code values.

Forms
Click the Forms button to select and open a saved form set, or if a form set has been loaded, save the current form set.
By design, the Forms button is not available for loaded Vizex layers (i.e. when opening the form set properties of a layer in the Vizex Layer Display pane). In Vizex, the Forms button is only available for new forms opened via the Home tab or the Vizex tab, in the Layer group (or by double-clicking on a form type node in the Vizex Layer Types pane).
Save and Save As
Click the Save button to save the changes you have made to the form set. Click Save As to save your changes as a new form set. Save As will default to the first available form set number.
Reset
Click Reset to clear the form of all values and reset the form to its default state.
Reset Tab
For tabbed forms, select Reset Tab to clear the active tab of all values and reset the tab to its default state - without making any changes to other tabs in the dialog.
Undo and Redo
Click Undo (CTRL + Z) to undo recent changes in the form. After an Undo, click Redo (CTRL + Y) to restore the last change that was undone.
Collapse
Collapse (roll-up) the form to preview a chart, or preview the results of an operation in Vizex, or obtain input values from Vizex, the Property Window, the File Editor, or the Plot Editor.