Display
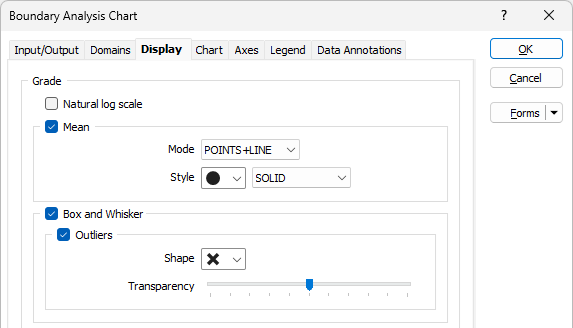
The Display tab of the Boundary Analysis form allows you to choose what to display on the chart. Significance tests are applied to determine the hardness or softness of the boundary. See: Soft and Hard Boundaries
Grade
Natural log scale
Select the check box to apply the Natural log scale for the data to the Grade values for the chart.
Mean
Select the check box to display the Mean grade values on the chart.
Mode
Choose how the mean grade values on the chart will be displayed (as POINTS, LINE, or POINTS + LINE).
Style
Use the drop downs to select the points and line Style for the mean grade values display. You can select from a number of symbols for Points and a style for Lines where applicable.
Box and Whisker
Select the check box to display the Box and Whisker plots for each distance bin.
Outliers
Select the check box if Outliers are to be displayed in the Box and Whisker values for the chart.
Shape
Use the drop down list to select a Shape to represent Outliers on the chart display.
Transparency
The Transparency slider controls the display of the selected Outliers shape on the chart. The transparency of the display can be set from 0 for invisible to 100 for completely visible.

Points
Select the Points check box to show all the raw data points on the chart, plotted by their distance from boundary, and grade.
Shape
Use the drop down list to select a Shape to represent Points on the chart display.
Transparency
Use the Transparency slider to set the transparency value for the display of the selected Points shape on the chart.

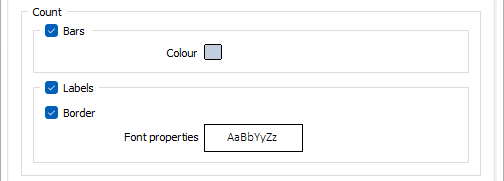
Count
Bars
Select the Bars check box to enable display of numerical counts for each distance bin, at the top of the chart.
Colour
Use the Colour box to select a colour for the Count series bars displayed on the chart.
Labels
Select the check box to display Labels for the Count series on the chart.
Border
With the check box selected, a Border will be displayed around the displayed labels.
Font properties
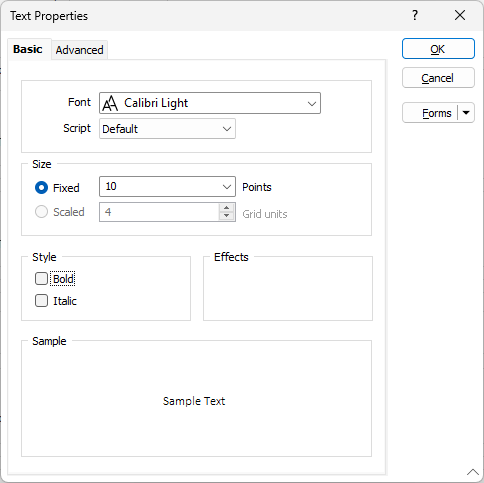
Double click in the Font properties box to open the Text Properties form.

Use the form to configure the font, size, style and advanced properties for the labels.

Domain Labels
Select the Domain Labels check box to enable the display of a label for each domain.
Border
Select the check box to display a Border around the domain labels.
Font properties
Double click in the Font properties box to open the Text Properties form and configure the font and other details for the domain labels.

Data Table
Select the Data Table check box to enable the display of a table of data at the bottom of the chart window.
Mode
Select the required Mode for the data table display - Simple or Detailed.
-
Simple mode will hide the percentiles, and outlier count rows on the data table. This mode is useful to control how many rows are displayed on the table. With information shown for each grade field, showing multiple grades can make the table large.
-
Detailed mode will display all of the information for the data table, including the percentile and outlier count.