Swath Plot
![]()
Swath plots are often used to validate resource estimation by comparing swath plots of original assays against a block model.
The variability along different vectors may be compared by plotting the results in a semi variogram map.
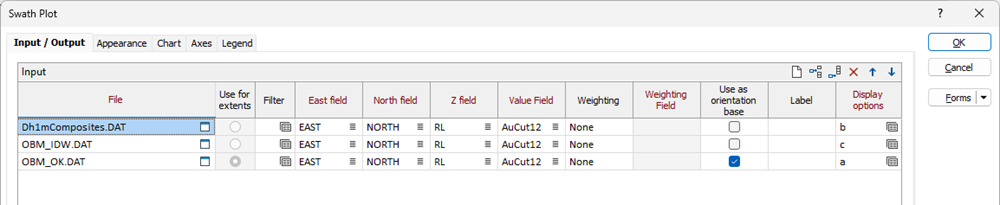
Input
Use the grid list to specify one or more input files, the coordinate fields in each file, the field contain the values to be plotted, and, if a weighting is applied, the field containing weighting values. You can also set chart (bar and line graph) colour options for the data that is plotted for each file.
Use the buttons on the local toolbar to Manage the rows in the list.
Use for extents
In Regular mode, this column is enabled when you have chosen to Use the extents from a selected input file (see Extents below). If you have specified more than one input file, select the file you want to use for the extents.
East, North, Z fields
Double-click (or click on the List icon) to select the fields containing the coordinates of the data points you want to calculate and plot
Value field
Double-click (or click on the List icon) to select the field containing the values you want to calculate and plot.
Note: Where a Y axis label has not been specified, the information from the Value field on the first row will be used to label the Y axis.
Weighting and Weighting Field
Choose whether to apply a weighting to the calculated statistic. You can weight by Volume (in the case of a block model file), or by the value in a nominated Weighting Field.
Weighting is ignored when Median or Mode are chosen as the calculated statistic (see below).
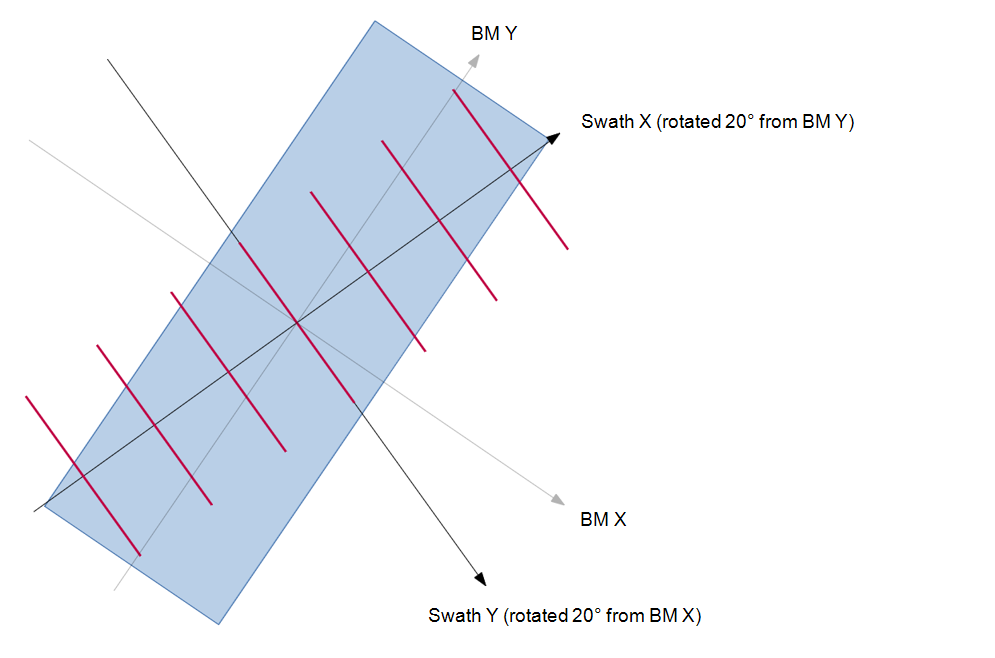
Use as orientation base
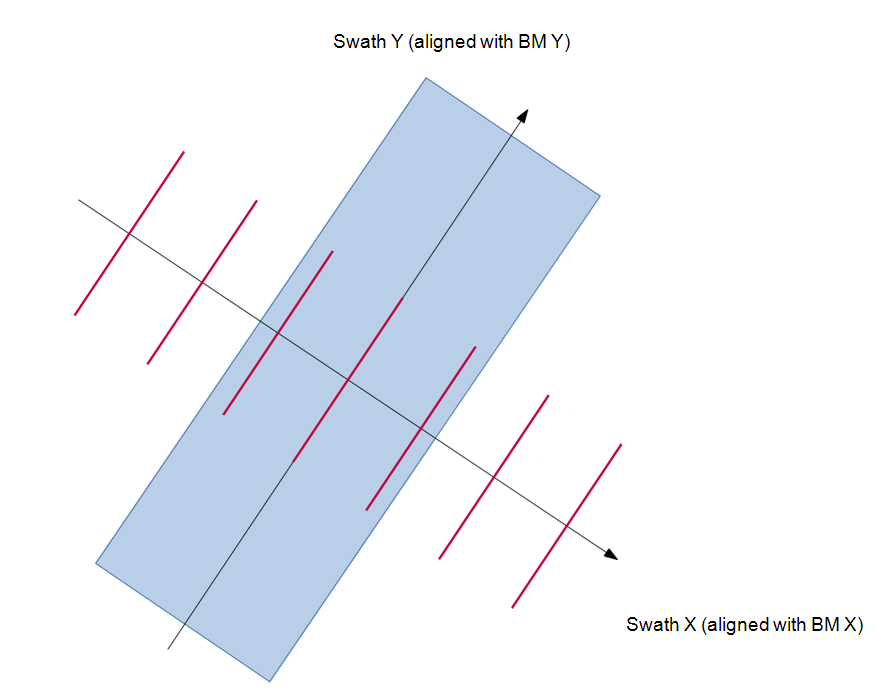
Select the input file you want to use as the basis for the orientation of the plot. The swath axis is aligned with the block model you select.
Note that you can also apply a custom rotation from plan view, looking north (see below). However, it is unlikely you would ever apply both.
Label
(Optional) Enter a label for each series. The labels you specify will be used in the Plot Legend and the Series Visibility drop-down.
Note that default labels in charts often use the input field name to label the data being plotted. If these fields are expressions, then the expressions will be used as the label text. To avoid this, you can use an additional attribute to define the label. See: Output Field Name Attributes
Display Options
Display Options can be saved and recalled as a form set. Right-click and select Edit (F4) to edit an existing form set. Right-click and select New to create a new form set. See:Display Options
Swath mode
Choose whether to create a plot in Regular mode or Section control file mode. The options you can select in the form will depend on your choice of mode.
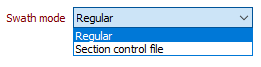
Swath Options
When a plot is created in Regular swath mode:
-
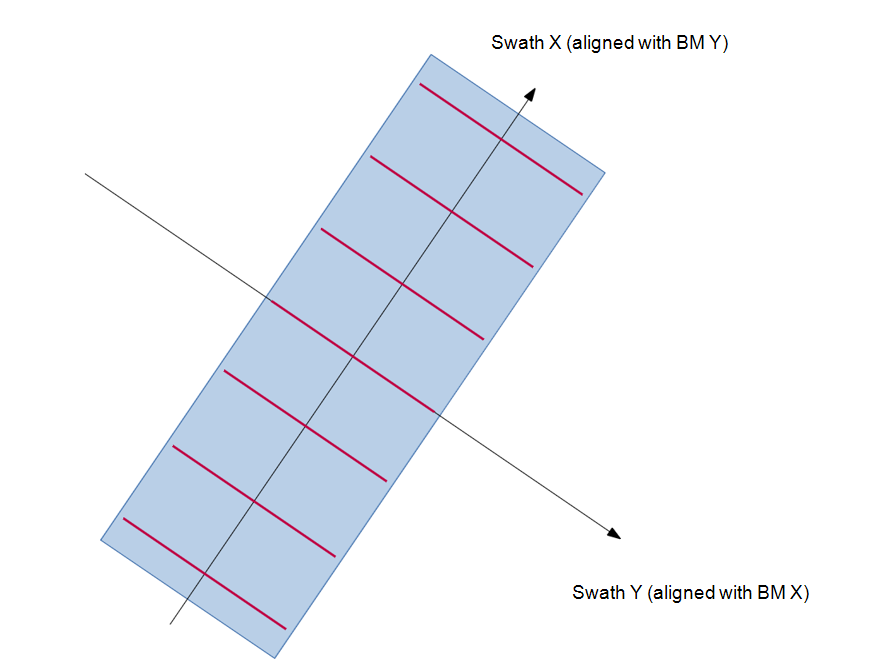
Specify an (EAST, NORTH, RL or Custom rotation) direction that defines the primary axis, or the trend of the slices or swaths.
-
If you have chosen the Custom rotation option, enter Azimuth, Plunge, and Rotation values that define the geological orientation of the swaths (in degrees). The primary axis is assumed to be Y (north), and the custom rotation is applied to that.
-
Specify the thickness of the slices or swaths you want to plot.
-
Specify the axes extents for the plot:
| Option | Description |
|---|---|
|
Min/Max |
Use the minimum and maximum global limits derived from the extents of the data in the input files. |
|
Overlapping |
Use the overlapping regions of the extents of the data in the input files |
|
Selected |
Use the extents of the data in a selected input file. See Use for extents in the Input grid (above). |
|
Custom |
Use custom start and end extents. Select this option to enter Start and End extent values in the input boxes provided. |
|
|
Note that you cannot set custom extents when a block model has been selected as the orientation base, nor when a custom orientation has been set. If you wish to achieve this, use a file filter instead. |
Choose the (Mean, Median, Mode) Grade Statistic that will be reported on the plot and in the Report file. When you select Median or Mode as the calculated statistic, the Weighting and Weighting field options you have set in the Input grid (if any) are ignored.
When a plot is created in Section control file swath mode:
-
Double-click to select a Section control file. A section control file is simply a Micromine (.DAT) data file that contains string definition and section (Inclination, Away, Towards and Step) definition fields.
The sections and the display limits in the file will be used to define the direction and thickness of the slices or swaths, and the axes extents for the plot.
Where sections overlap, points are only accumulated in the first section they occur.
You can show each Section Name by selecting that option in the X Axis Customisation and the Value Point Label Customisation groups on the Appearance tab of the Swath Plot form.
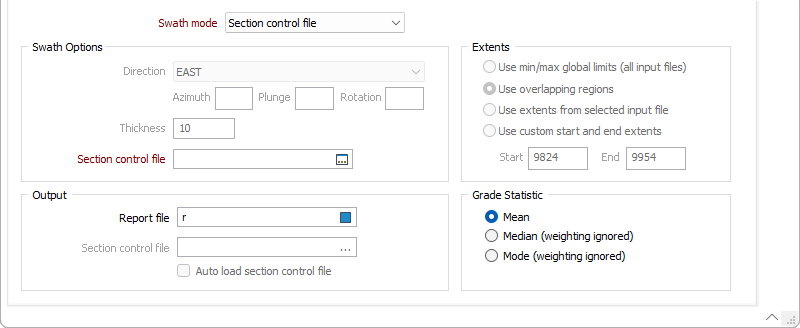
Choose the (Mean, Median, Mode) Grade Statistic that will be reported on the plot and in the Report file. When you select Median or Mode as the calculated statistic, the Weighting and Weighting field options you have set in the Input grid (if any) are ignored.
Output
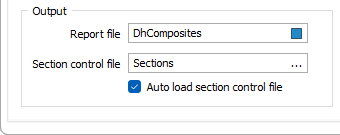
Report file
Enter (double-click or click on the Select icon) to select the name of the Report File that will be written as a result of the process. To see the contents of the file, right-click in the file box and select View (F8).
The Report Viewer is opened for any Statistical function that generates a Report file. Click the Form button on the Viewer toolbar to re-open the form, adjust the parameters of the Statistical calculation, and then choose to overwrite or append to the output in the Viewer window.
Section control file
When a plot is created in Regular swath mode, the option to write the direction and thickness of the slices or swaths, and the axes extents, to a Section control file is provided. Double-click to select the file.
Auto load section control file
Select this option to visualise the swaths and the axes extents written to the Section control file.
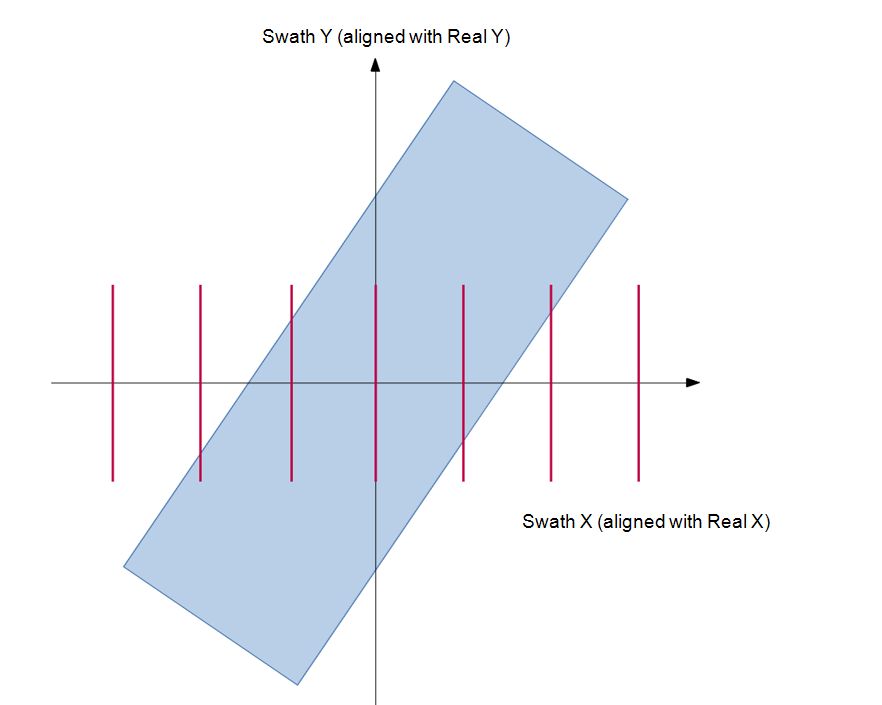
Initial form set (by default, swaths are created along the X axis, no orientation options are set):
“Use as orientation base” set, aligns swath axis with block model:
A different “primary axis” is selected:
A custom rotation is applied:
Forms
Click the Forms button to select and open a saved form set, or if a form set has been loaded, save the current form set.
By design, the Forms button is not available for loaded Vizex layers (i.e. when opening the form set properties of a layer in the Vizex Layer Display pane). In Vizex, the Forms button is only available for new forms opened via the Home tab or the Vizex tab, in the Layer group (or by double-clicking on a form type node in the Vizex Layer Types pane).
Save and Save As
Click the Save button to save the changes you have made to the form set. Click Save As to save your changes as a new form set. Save As will default to the first available form set number.
Reset
Click Reset to clear the form of all values and reset the form to its default state.
Reset Tab
For tabbed forms, select Reset Tab to clear the active tab of all values and reset the tab to its default state - without making any changes to other tabs in the dialog.
Undo and Redo
Click Undo (CTRL + Z) to undo recent changes in the form. After an Undo, click Redo (CTRL + Y) to restore the last change that was undone.
Collapse
Collapse (roll-up) the form to preview a chart, or preview the results of an operation in Vizex, or obtain input values from Vizex, the Property Window, the File Editor, or the Plot Editor.