QKNA
![]()
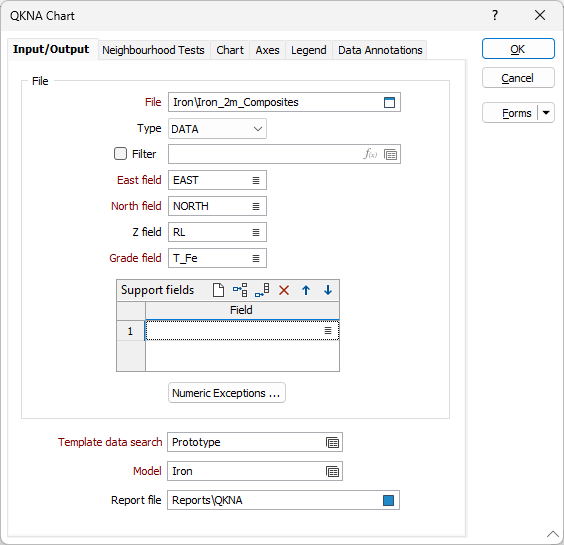
Input
File
Select a file type and then double-click, or click on the Select icon, to select the file containing the grades you want to generate top cut values for.
East, North, Z fields
Double-click (or click on the List icon) to select the fields containing the coordinates of the data points you want to calculate and plot.
The specification of a Z field is optional. If left blank, Z centre, Z dimension, and Z discretisation parameters will be disabled in the Neighbourhoods grid. See: Neighbourhoods
Grade field
Double-click, or click on the List icon to select the field in the file that contains the grade values.
Support fields
To support multivariate data for Co-kriging, specify one or more fields. These fields will be shown in the chart
Note that default labels in charts often use the input field name to label the data being plotted. If these fields are expressions, then the expressions will be used as the label text. To avoid this, you can use an additional attribute to define the label. See: Output Field Name Attributes
Numeric Exceptions
(Optionally) Use the Numeric Exceptions group to control the way that non-numeric values are handled. Non-numeric values include characters, blanks, and values preceded by a less than sign (<).
Output
Template data search
Double-click in the Template Data Search input box to load a form set. Alternatively, right-click to open a form where you can define the shape and direction of the search ellipsoid. See: Ellipsoid Parameters
Model
Double-click in the Model input box to load a form set. Alternatively, right-click to setup semi variogram model parameters. See: Semi Variogram Parameters
Report file
Enter (double-click or click on the Select icon) to select the name of the Report File that will be written as a result of the process. To see the contents of the file, right-click in the file box and select View (F8).
The Report Viewer is opened for any Statistical function that generates a Report file. Click the Form button on the Viewer toolbar to re-open the form, adjust the parameters of the Statistical calculation, and then choose to overwrite or append to the output in the Viewer window.
Forms
Click the Forms button to select and open a saved form set, or if a form set has been loaded, save the current form set.
By design, the Forms button is not available for loaded Vizex layers (i.e. when opening the form set properties of a layer in the Vizex Layer Display pane). In Vizex, the Forms button is only available for new forms opened via the Home tab or the Vizex tab, in the Layer group (or by double-clicking on a form type node in the Vizex Layer Types pane).
Save and Save As
Click the Save button to save the changes you have made to the form set. Click Save As to save your changes as a new form set. Save As will default to the first available form set number.
Reset
Click Reset to clear the form of all values and reset the form to its default state.
Reset Tab
For tabbed forms, select Reset Tab to clear the active tab of all values and reset the tab to its default state - without making any changes to other tabs in the dialog.
Undo and Redo
Click Undo (CTRL + Z) to undo recent changes in the form. After an Undo, click Redo (CTRL + Y) to restore the last change that was undone.
Collapse
Collapse (roll-up) the form to preview a chart, or preview the results of an operation in Vizex, or obtain input values from Vizex, the Property Window, the File Editor, or the Plot Editor.