Neighbourhood Tests
Use the Neighbourhood Tests tab of the QKNA form, to setup one or more search neighbourhoods using the form sets created on the Input tab of the form.
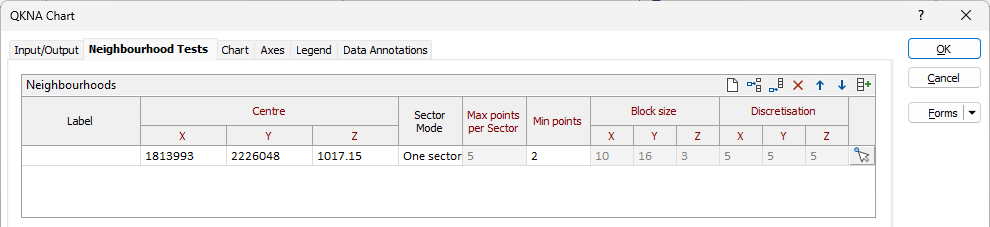
Neighbourhoods
In the Neighbourhoods grid, the entries you make on each row of the grid define the shape, size and other characteristics of an ellipse that defines a search neighbourhood. The values used to obtain an estimate for each block are controlled by the search ellipse. Use the buttons on the local toolbar to Manage the rows in the list.
A good approach is to click the Autofill button on the grid toolbar to select a saved Search Neighbourhood form set. The chosen form set is used to populate a row in the grid.
Label
Optionally, enter a label that identifies each neighbourhood.
Centre
The centroid of the search ellipsoid for each neighbourhood defined in the grid.
![]() It may be useful to interpolate a point in Vizex. To collapse the form, click the Pick Point icon at the far right of each row of the grid:
It may be useful to interpolate a point in Vizex. To collapse the form, click the Pick Point icon at the far right of each row of the grid:
The coordinates of the points you pick are loaded into the grid on that row.
Parameters
Sector mode
This number defines how many parts the search shape will be divided into for the data search. The maximum number of points is multiplied by the number of sectors to determine how many data points can be used within the overall search shape. See: Sectors
Max points per sector
The maximum number of points to be used in the estimation of a block value. The maximum allowable value is 150. When more than one sector is defined, each sector can independently use up to the maximum number of points. (e.g. 150 pts x 4 sectors = 600 pts).
If more than the maximum number of points is found within a sector the closest points are used.
Min points
Optionally, specify the minimum number of points to be used in the estimation of a block value.
Block Size
Set the Easting, Northing, Z dimensions of the blocks that will be written to the output file. The block dimensions chosen for estimation should be consistent with the sampling grid of the input data; blocks that are too small will cause over-smoothing of the estimated block grades.
Note: Block Size and Discretisation inputs are enabled when the “Optimising block model parameters” check box (see below) is selected. Z centre, Z dimensions, and Z discretisation inputs are disabled when the Z field input has been left blank on the Input tab of the form.
Discretisation
Specify the number of divisions in the East, North, and Z directions. These are integer values that control the number of discrete points to be estimated in each direction within each block. The values of all the discretised points are then averaged to estimate the value for the block, and the result of each block written to the output file.
For example, if you choose 4 East divisions, 4 North divisions, and 4 Z divisions, the application will interpolate and average a total of 64 estimates within each block. Although the estimates for a given block all share the same input data, the distance from each input sample (and thus the weight) will be slightly different for each discretised point, producing a different result for each one. The result is a more accurate estimate, but at the cost of more computing time.
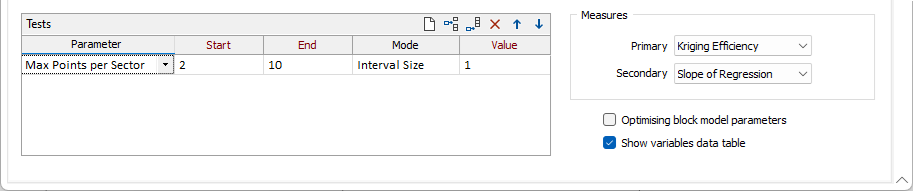
Tests
On each row of the Tests grid, select a parameter you want to experiment with and enter the parameter value to use.
Selecting a parameter will disable the corresponding parameter in the Neighbourhoods grid. See Parameters (above).
The values of the parameters that are not being tested, are taken from the Neighbourhoods grid.
When you click OK to generate the chart, a test of the parameter values you have defined in the Tests grid, will be run for each iteration/search neighbourhood in the Neighbours grid.
Start/End
Enter a Start and End value.
Mode
Select a mode to restrict the number of samples selected from any one drillhole:
| Mode | Description |
|---|---|
| Interval Count | The maximum number of intervals to process. |
| Interval Size | The maximum interval size of the intervals to be processed. |
Value
Enter a value for the Mode parameter you have selected (above).
Measures
Each test has a set of measured results. You can choose which Primary-Secondary measure combination to show in the chart (both here and on the chart toolbar).
When you select measures on the chart toolbar, you can analyse the results to determine which test yields the best result (the parameters that yields the number closest to 1 for most of the performance measures), and then click an Apply Variables button to insert the variables for that test into the Neighbourhoods grid.
You can then repeat the process, changing which parameter to experiment with in the Tests grid.
You can also experiment with multiple parameters by defining multiple rows in the Tests grid. A test will be created for each combination of parameter values that you specify.
Note: The chart title will default to list the currently tested parameters, and this may become over-long when three or more parameters are tested at the same a time.
Measures
Select the Primary and Secondary measures to display on the X and Y axes of the chart. These may be used to inform decisions regarding data selection and kriging type:
| Measure | Description |
|---|---|
| Slope of Regression | Provides a measure of the conditional bias in the estimates. |
| Kriging Efficiency |
A goodness of fit - the kriging variance normalised by the variance of the blocks, expressed as a percentage. |
| Percent Negative Weights | The proportion (percentage) of negative kriging weights in the estimates. |
| Kriging Variance | The minimised mean squared error variance. |
Optimising block model parameters
Note: Block Size and Discretisation inputs in the Neighbourhoods grid are enabled when this check box is selected. To run neighbourhood tests in a simpler mode, deselect the check box.
Show variables data table
Select this check box to display a Variables Data Table alongside the chart.