Chart | QKNA
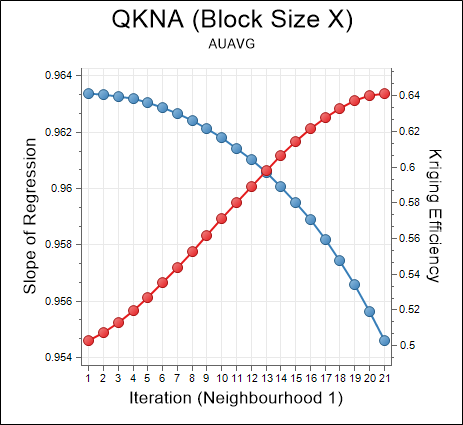
The QKNA chart plots Kriging Efficiency versus Block Size and may be used to select an optimal block size for modelling.
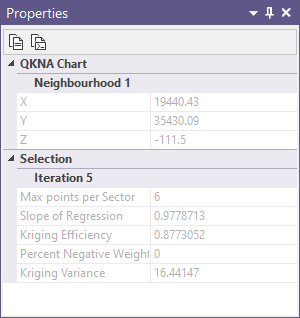
The Chart window comprises two parts: the graph and the Properties Pane:
When you generate a chart, many of the tools and options on the Chart ribbon are common to most charts. See: Chart Tools
Tools on the Chart | QKNA tab, in the QKNA group, allow you to:
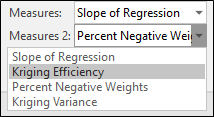
- Select the measures that will be displayed on the X and Y axes.
- Apply the currently selected experimental variables:
![]()
- View the previous iteration/neighbourhood (Left key).
![]()
- View the next iteration/neighbourhood (Right key).
![]()