Appearance
Use the Appearance tab of the Swath Plot form to customise the appearance of the labels around each value point, and along the X and Y axes. An option to transpose the axes is also provided.
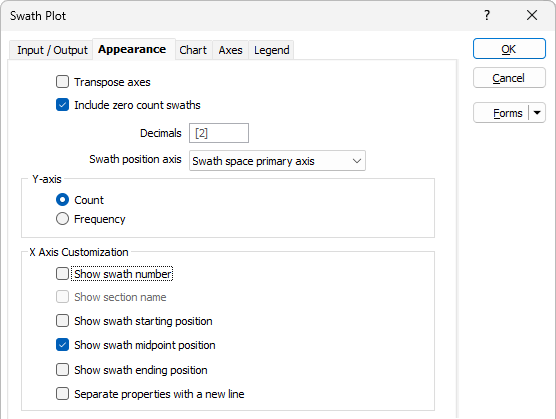
Transpose axes
Select this option to transpose the X and Y axes on the graph. This is useful when doing swaths against RL, for example, to provide a visual comparison against the data.
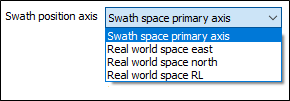
Swath position axis
Enter the number of decimal places and choose a position axis.
Swath position axis refers to the position values plotted on the graph. For example, if you have selected “Use as orientation base” to align the swath axis with a block model, you may still prefer to display the swath information using the real-world X axis position.
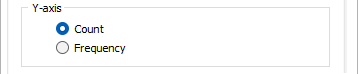
Y Axis
Choose whether to show Count or Frequency values for the values along the Y axis. If no weighting is used, Count is the Frequency of the values as a percentage of the file total count. If weighting is used, then the Frequency represents the sum of the weights as a proportion of the sum of the file weights.
If no name for the Y axis is entered on the Axes tab, the Y axis title will be taken from the first value in the Value column of the Swath Plot tab.
The default name of the secondary Y axis is determined by this selection - Count or Frequency.
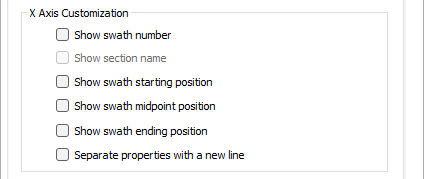
X Axis Customisation
Select the check boxes to choose what to show along the X axis of the plot:
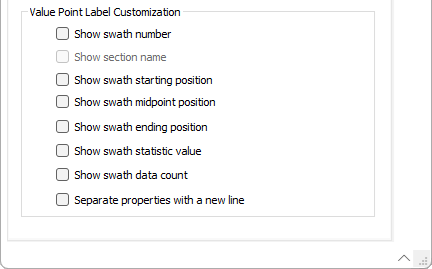
Value Point Label Customisation
Select the check boxes to choose what to show for each value point on the plot: