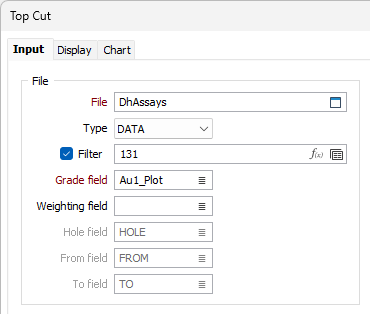
Input
![]()
The top cut value can be hard to determine when the data includes extreme but otherwise valid values. Because of this uncertainty, it is important to determine the cut value using as many methods as possible for each element in each domain. Although the results of the different methods are unlikely to agree, an informal weight-of-evidence assessment should reveal a range of preferred values. You may also choose to omit the top cut altogether if your data does not include any outliers.
For an overview, see: Top Cut
File
Select a file type and then double-click, or click on the Select icon, to select the file containing the grades you want to generate top cut values for.
Grade field
Double-click, or click on the List icon to select the field in the file that contains the grade values.
Note that default labels in charts often use the input field name to label the data being plotted. If these fields are expressions, then the expressions will be used as the label text. To avoid this, you can use an additional attribute to define the label. See: Output Field Name Attributes
Weighting field
For each input file, optionally select a Weighting field. When a Weighting field is applied, weighted means, standard deviations, confidence intervals and variances will be written to the report file. If no Weighting field is specified, un-weighted values will be written to the report file.
Hole, From, To fields
The fields that identify the From -To intervals for each Hole in the Input file are specified here. These options are only required where the Relative Nugget vs Top cut graph is selected in the Top Cut Graphs grid. They will be inactive for all other graphs, even when information is available and automatically displayed in the inactive fields.
Bins
Minimum
Enter the minimum value that will be shown on the graph. If you click the Auto-calculate icon to obtain a value, it will be adjusted automatically.
Note: If the Natural log scale option is selected, the minimum value must be greater than zero.
Bin size
The bin size defines the interval between successive increments (the width of the bars) on the graphs. If, for example, the bin size is set to 0.1 (with the first bin ending at 0.05), the boundaries will be at 0.15, 0.25, 0.35 and so on.
Enter a value or click the Calculate button to generate a bin size based on the other inputs.

For detailed analysis, aim for around 50 bins. One rule of thumb for choosing the best bin size is to measure the range of the data (subtract the minimum value from the maximum value) and divide the result by 50. You may then use that value or round it to a simpler number.
Maximum
Enter the maximum value that will be shown on the graph. If you click the Auto-calculate icon to obtain a value, it will be adjusted automatically.

Natural log scale
When this option is chosen, the values in the Grade field are converted into their natural logarithm. In this case, the minimum data value specified by the graph minimum must be greater than zero.
You can also toggle between Normal and Natural log scale from the Chart toolbar:

Define Final Top Cut
The specification of a Final Top Cut value makes it possible to compare the pre-cut and post-cut (mean grade, cut variance, cut standard deviation) ore grade statistics in the Property Window.
If a Final Top Cut value is specified, or is edited in the Property Window, that value is applied to the series of graphs and a shadow of the original series is shown on the chart.
If a Final Top Cut value is not specified, the statistics shown in the Property Window are un-cut statistics.
Numeric Exceptions
(Optionally) Use the Numeric Exceptions group to control the way that non-numeric values are handled. Non-numeric values include characters, blanks, and values preceded by a less than sign (<).

Top Cut Graphs
Use the tools on the Chart | Top Cut tab, or press enter in the grid list, to add a new chart, and use the drop-down menu to select a Graph type:
You use the Top Cut chart to assess potential top cut values by combining up to nine of the following methods on a single chart. You then select the top cut candidates in each chart and compare them with the others:
- Histogram: If abnormally high grades appear as a distinct population in the histogram, use statistical decomposition to determine the boundary value, which then becomes the cut value.
- Cumulative Frequency curve or Probability Plot: Look for break-up near the right-hand end of the graph. The grade at which the graph breaks up is the cut value.
- Mean vs. Top Cut: Inspect the plot for a change in slope, which may indicate a change in sensitivity to the cut value.
- Relative Nugget vs. Top Cut: Assesses short-scale continuity as defined by the relative nugget. Look for the minimum value within a zone of coherent points, which indicates the best grade continuity.
- Quantile Analysis: Assesses the individual quartiles in the dataset, working through a series of rules that indicate if a top cut is warranted. See: Quantile Analysis
Use the buttons on the local toolbar to Manage the rows in the list.
Use the check boxes to include or exclude graphs from the chart. You can display up to nine charts at once in the Top Cut window. See: Chart | Top Cut
Use the Up and Down arrows on the grid toolbar to rearrange the order of the graphs on the chart.

Forms
Click the Forms button to select and open a saved form set, or if a form set has been loaded, save the current form set.
By design, the Forms button is not available for loaded Vizex layers (i.e. when opening the form set properties of a layer in the Vizex Layer Display pane). In Vizex, the Forms button is only available for new forms opened via the Home tab or the Vizex tab, in the Layer group (or by double-clicking on a form type node in the Vizex Layer Types pane).
Save and Save As
Click the Save button to save the changes you have made to the form set. Click Save As to save your changes as a new form set. Save As will default to the first available form set number.
Reset
Click Reset to clear the form of all values and reset the form to its default state.
Reset Tab
For tabbed forms, select Reset Tab to clear the active tab of all values and reset the tab to its default state - without making any changes to other tabs in the dialog.
Undo and Redo
Click Undo (CTRL + Z) to undo recent changes in the form. After an Undo, click Redo (CTRL + Y) to restore the last change that was undone.
Collapse
Collapse (roll-up) the form to preview a chart, or preview the results of an operation in Vizex, or obtain input values from Vizex, the Property Window, the File Editor, or the Plot Editor.