Quantile Analysis
Quantile (Decile) analysis works by analysing the metal content of the individual deciles in a dataset, working through a series of rules that indicate if a top cut is warranted. The analysis starts with the entire data set and then concentrates on the 90th to 100 deciles if a top cut is indicated. The sequence of rules is:
Full data set:
- If the top decile has more than 40% of the metal, cutting the high assays may be warranted.
- If the top decile (90% to 100%) has more than twice the metal content of the 80% to 90% decile, cutting may be appropriate.
90th to 100th deciles:
- If the top percentile (or the top two or more percentiles each) has greater than 10% of the total metal content, then cutting is warranted.
- If the top percentile has less than a full complement of samples, cutting may be warranted even where the percent of metal content is lower than 10%.
- If there is only 50% of a full complement, or roughly a half-percentile present, then a metal content above 5 % would suggest that cutting is appropriate.
To carry out a Decile analysis:
The Quantile Analysis chart initially shows the metal deciles of the full dataset along with pass/fail indications in the Chart Properties for the first three rules. If no top cut is advised, no further information is shown.
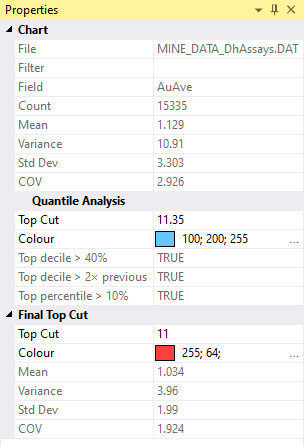
If a top cut is advised, the chart is divided into two parts: the full dataset on the left (as deciles) and the 90th to 100th percentiles on the right, with a scale change between the 90th and 91st percentile. The remaining rules are calculated, and an estimate of the top cut is produced. You can optionally use the slider to adjust the cut value.
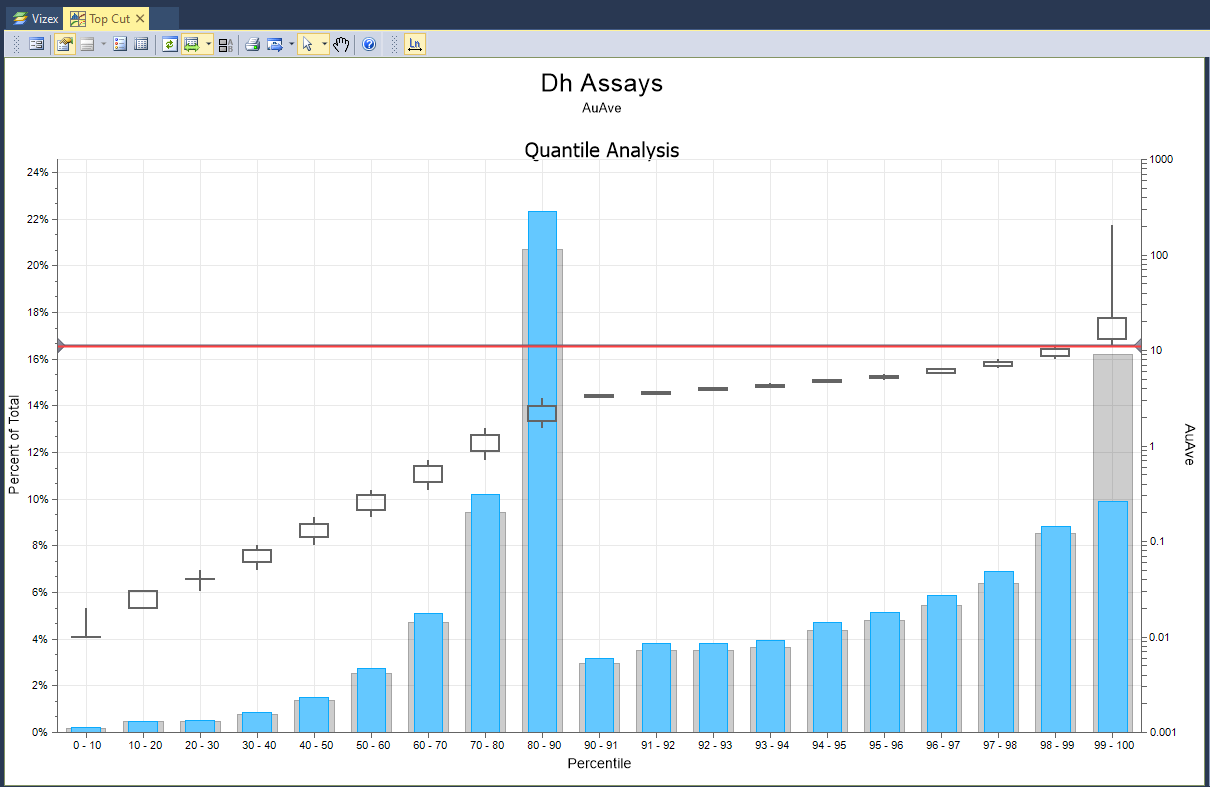
Click on a candlestick in the chart to view the minimum, maximum and IQR (interquartile range) of each quantile, along with the percent of total and number of samples.
To rerun the calculation, erase the existing top cut value from the form and then click OK.
As with any Top Cut method, optionally compare the cut value using other methods in the Top Cut chart.
To carry out Quantile analysis and generate a report file, see: Quantile Analysis