Chart | Search Neighbourhood
The Search Neighbourhood Stats chart provides a visual indication of which points lie within a neighbourhood.
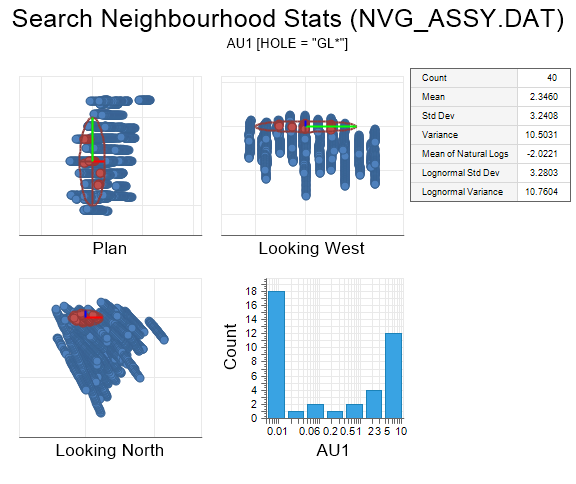
Summary statistics, and a histogram of the grades of those points, are also provided.
When you generate a chart, many of the tools and options on the Chart ribbon are common to most charts. See: Chart Tools
Tools on the Chart | Search Neighbourhood tab, in the Search Neighbourhood group, allow you to:
- Pick a point in Vizex as the centroid of the search ellipsoid:
![]()
- Show/hide ignored points:
![]()
- Select points in the chart that meet the search criteria:
![]()