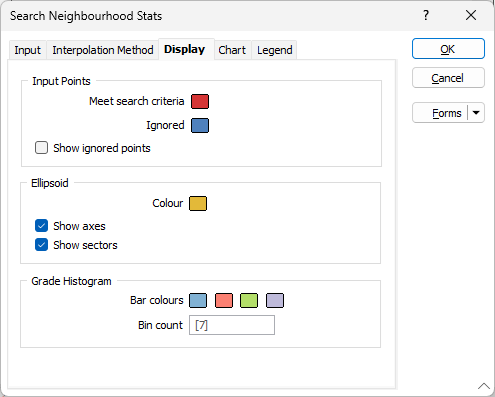
Display
On the Display tab of the Search Neighbourhood form, set display options for the input points, the ellipsoid, and the grade histogram.
Input Points
Colour
Double click (F3) the colour buttons to select a display colour for the points that meet the search criteria and the points that are ignored.
Ellipsoid
Colour
Double click (F3) the colour button to select a display colour for the ellipsoid.
Show axis
Select this option to display an orientation axis which provides a visual indication of where in space the camera currently is. The colours used for the axis lines are the same as those used for the orientation axes in Vizex:
- red = X
- green = Y
- blue = Z
Show sectors
Select this option to display the sectors of the ellipsoid object.
Grade Histogram
Bar Colours
Double click (F3) the colour buttons to select display colours for the bars of the histogram. If you have specified one or more support fields on the Input tab of the form, these fields will be shown in the grade histogram and will use the colours specified here. The first field will use the first colour, the second field will use the second colour, and so on.
The colour assignment will wrap around if there are 5 or more fields, however it is unlikely more than 2 or 3 fields will be specified.
Bin Count
Enter, or accept the default [7], number of bins.