Chart | Change of Support
A change of support model may provide a target for an estimated grade distribution and is useful when evaluating recoverable resources.
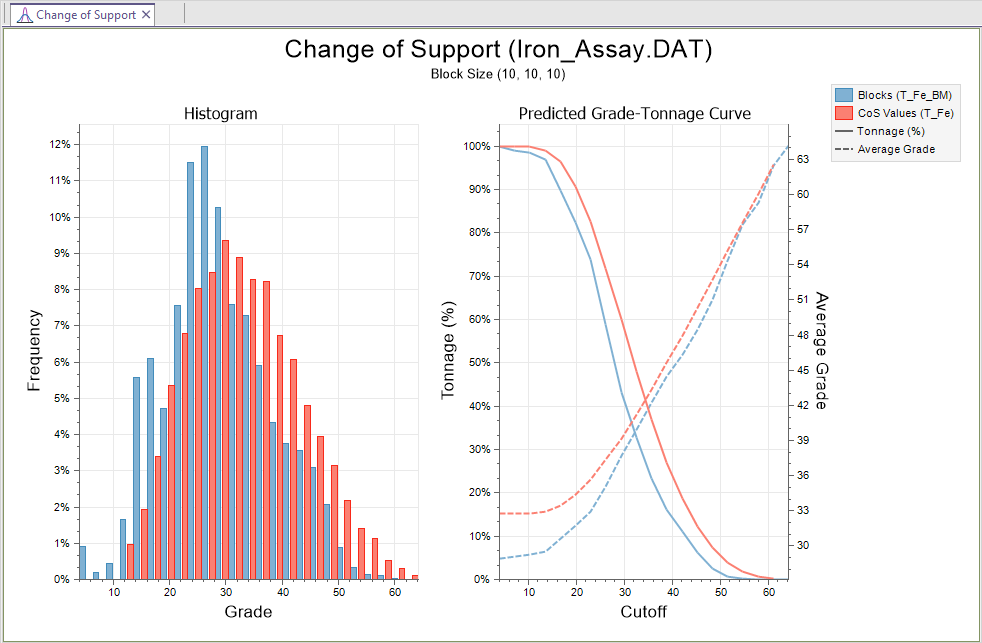
The Chart | Change of Support window provides a graphical view of the effect of a change of support transformation on a set of data. The chart comprises two parts: a histogram of the grade distribution (left) and a plot of the input and final grade tonnage (right).
The following is an example of the displayed transformation:
When you generate a chart, many of the tools and options on the Chart ribbon are common to most charts. See: Chart Tools
You can use the Select, Zoom and Pan tools on the Chart toolbar to examine the effects of changes on sections of the distributions that are of interest.
Tools on the Chart | Change of Support tab, in the Change of Support group, will vary depending on the parameters you have specified in the form.
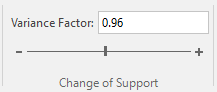
If you have manually entered a Variance factor on the CoS tab of the form:
- Adjust the slider to change the variance factor while interacting with the chart. Alternatively, enter a variance factor value in the input box provided:
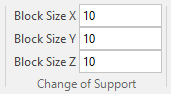
If you have calculated the Variance factor based on the parameters specifed on the CoS tab of the form:
- Adjust the X, Y and Z block size values for the variance factor calculation: