Cell Declustering
A typical mineral deposit is sampled in such a way that high grades or potential ore are sampled more densely than low or unmineralised grades. This over-sampling of high grades is called clustering. If a simple mean of these grades is calculated, the high grades will overwhelm the average value and produce a result that is too high.
![]()
Declustering relies on the assumption that clustered samples, being close together, are somewhat correlated and may include some redundancy. Because of this redundancy, the clustered grades must be allocated lower weights than their un-clustered neighbours. Once this is done, a weighted average is calculated instead, which is known as a declustered mean.
Input File
Input
Select a file Type and double-click (or click on the Select icon) to select the name of the Input file. If required, define a Filter to restrict the process to a subset of the records in the file.
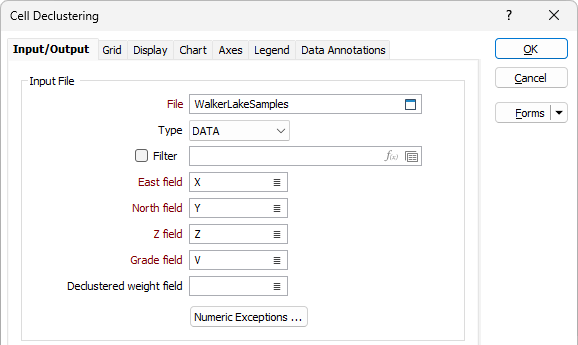
East, North and Z fields
Specify East, North and Z coordinate fields.
Grade field
Enter the names of the field for which the declustering calculation will be applied.
Numeric Exceptions
(Optionally) Use the Numeric Exceptions group to control the way that non-numeric values are handled. Non-numeric values include characters, blanks, and values preceded by a less than sign (<).
Declustered weight field
The application uses 3D block declustering to calculate declustered weights. The method assumes that equal volumes within a mineral deposit should contribute equally to the overall grade, regardless of the number of samples within them. It does this by dividing the mineralisation into virtual rectangular prismatic blocks and counting the number of samples falling within each block. The weight assigned to each sample is simply the reciprocal of the number of samples; clustered samples are assigned small weights and isolated samples are assigned large weights. For example, if a virtual block includes five samples, each sample within it is allocated a weight of 0.2.
You enable this operation by defining a Declustered Weight field, which automatically assigns the calculated weights to the input samples. Enter (or double-click, or click on the List icon, to select) the name of the field.
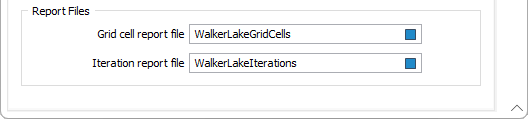
Report Files
Grid Cell Report File
Select this option to write the following statistics to a report file for each cell that contains data:
-
Sample Count
-
Mean
-
Std. Dev.
-
World Position
-
Indexed Position
The Grid Cell Report File is updated when you click Write Iteration Results, in the Chart | Cell Declustering window, to write the declustered weights of the selected iteration.
Iteration Report file
Select this option to write each iteration, its cell size and its calculated stats, to a report file. This is effectively a copy of the iteration data table shown on the chart.