Chart | Cell Declustering
The Chart | Cell Declustering window comprises two parts: the Graph and the Properties Pane. The Graph comprises two parts:
- Horizontal lines at the mean (M) and standard deviation (SD) of the declustered points.
- An Iteration data table (if you have chosen to include it).
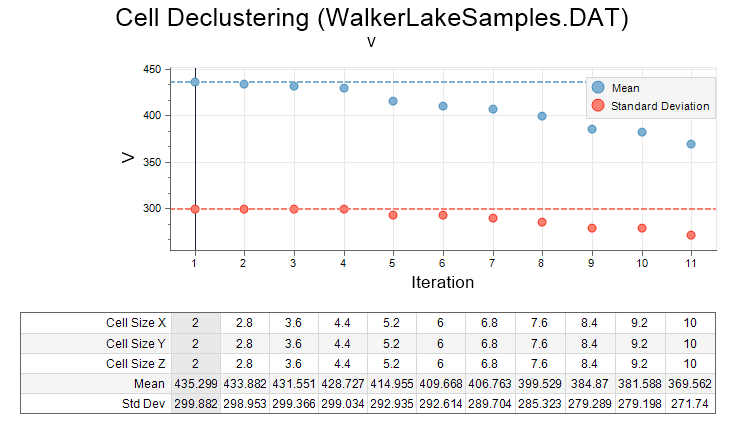
Once the iterations are complete, simply read the mean and standard deviation of the chosen iteration by selecting the corresponding point in the chart. When high grades are preferentially sampled, which is typical for the primary elements of most ore deposits, the lowest mean is the declustered mean. The opposite may be true for penalty elements: when low grades are preferentially sampled, the highest mean is the declustered mean. However, if the calculated mean seems too low (or too high), choose a value from a less aggressive iteration.
- Select an iteration from 1 to the Count value you have specified in the Cell Intervals group on the Input tab of the form:
- Click Write Iteration Results to write the declustered weights of the selected iteration to the Input file and update the Grid Cell Report File (if specified on the Input/Output tab of the form).
![]()
Load a Chart Form Set
To display an existing form set in a new chart:
- Click the Forms button at right of the form and choose the form set.
- Click OK to apply the settings to the new chart.
Errors at this point will typically refer to a new chart feature with no equivalent in the old graph. To assist you, the application will highlight the offending form response once you read and dismiss the error message.
When you generate a chart, many of the tools and options on the Chart ribbon are common to most charts. See: Chart Tools