Display
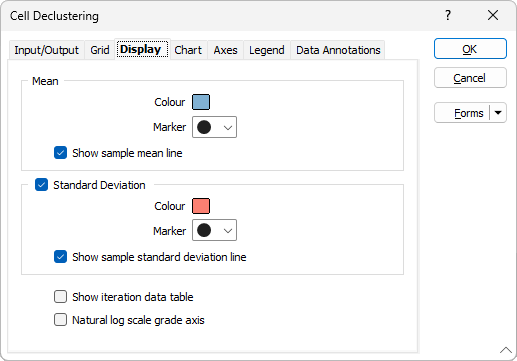
On the Display tab of the Cell Declustering form, set colour and symbol options and choose whether to show:
-
the sample mean line
-
the sample standard deviation line
-
an iteration data table on the chart
-
a natural log scale on the Y (grade) axis