Clustering
![]()
Input
File
Select a file Type and double-click (or click on the Select icon) to select the name of the source File. If required, define a Filter to restrict the process to a subset of the records in the file.
Fields
Records in the input file will be clustered based upon the unique values in one or more of the fields you have selected.
The maximum number of components extracted will equal the number of element variables. Eigenvectors are the variances of the principal components, and these are used to calculate principal component scores. The coefficients indicate the relative weight of each variable in the component.
![]()
Parameters
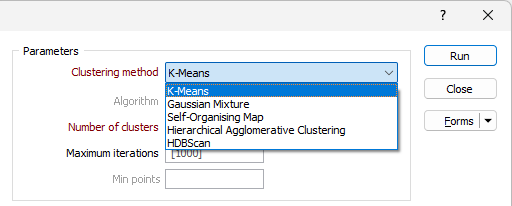
Clustering method
Choose a Clustering method:
|
Method |
Description |
|---|---|
| K-Means | A distance-based algorithm is used to partition n points into k clusters. Each point belongs to the cluster with the nearest mean (cluster centroid) which serves as a prototype of that cluster. |
| Gaussian Mixture | A mixture of normal distributions that represent the overall probability distribution of the data points. |
| Self-Organising Map | An artificial neural network (ANN) is trained to perform a dimensionality reduction to create a discretised representation (neighbourhood map) of the input data. |
| Hierarchical Agglomerative Clustering | A distance-based algorithm is used to cluster data in a hierarchy, in the same way as a Dendrogram is calculated. A calculation algorithm can be selected for Hierarchical Agglomerative Clustering. |
| HDBScan | HDBScan uses density-based spatial clustering and integrates results to find a clustering that gives the best stability. Hierarchical density-based scanning is able to find clusters of varying densities and is adaptable to diverse selection parameters. |
Algorithm
If Hierarchical Agglomerative Clustering is selected, the Algorithm drop down is enabled.
![]()
|
Method |
Description |
|---|---|
| Average | Distance between two clusters is the average of all pairwise distances between points in the clusters. The Average method produces balanced clusters and is a middle ground between single and complete linkage. It produces balanced clusters that are good for most cases. |
| Complete | Distance between two clusters is the largest distance between any two points in the clusters. The Complete method can struggle with very large datasets (over ~80K samples) but tends to create compact, well-separated clusters and is less sensitive to noise. It is good for detecting well-separated, dense clusters. |
| Single | Distance between two clusters is the smallest distance between any two points in the clusters. The Single method is faster and more memory-efficient for large datasets. It is more likely to produce long, chain-like clusters than other methods and is sensitive to noise/outliers. This method is good for very large datasets where the other methods run out of memory and good at detecting elongated clusters but may not separate well-defined groups. |
Number of clusters
Specify the number of clusters to be defined. This value essentially defines how far down the hierarchy to stop when defining the clusters.
Maximum iterations
Specify the maximum number of iterations the clustering method will go through. The method may stop early if the clustering criteria are satisfied. The Maximum iterations option is disabled if the Hierarchical Agglomerative Clustering method is selected.
![]()
Min cluster size
The Min cluster size field is enabled for the HDBScan clustering method. Cluster assigning is performed based on the minimum size entered.
Min points
The Min points field is enabled for the HDBScan clustering method. Specify the minimum number of points that can be used to define a cluster by density.
![]()
Transformation
Select the check box to enable the transformation method options.
Transformation Method
Choose a transformation method:
|
Method |
Description |
|---|---|
| Z-Score | Data is transformed by subtracting the mean value for each field from the values in the compositional data and then dividing by the standard deviation of each field, resulting in data with a mean of zero and a standard deviation of one. |
| Centred Log-Ratio (CLR) | A centred log-ratio transformation is undertaken to remove the effects of closure in the compositional data. |
![]()
Zero Replacement
If you selected Centred Log-Ratio as the Transformation method, choose how zero values will be handled:
-
Ignore sample
-
Treated as half of minimum positive values
Sample Weight
Select this check box if you want to specify the sample weight data to be used in the clustering. Select the Weight Field to specify the field containing sample weight data.
![]()
Output
Modify input file
If this option is selected, the results of the process will be written to the Input file. If the Modify input file option is not selected, double-click (F3) to select the name of an Output file.
In the nominated file, you must specify a field to which the Cluster IDs will be written.
![]()
Forms
Click the Forms button to select and open a saved form set, or if a form set has been loaded, save the current form set.
By design, the Forms button is not available for loaded Vizex layers (i.e. when opening the form set properties of a layer in the Vizex Layer Display pane). In Vizex, the Forms button is only available for new forms opened via the Home tab or the Vizex tab, in the Layer group (or by double-clicking on a form type node in the Vizex Layer Types pane).
Save and Save As
Click the Save button to save the changes you have made to the form set. Click Save As to save your changes as a new form set. Save As will default to the first available form set number.
Reset
Click Reset to clear the form of all values and reset the form to its default state.
Reset Tab
For tabbed forms, select Reset Tab to clear the active tab of all values and reset the tab to its default state - without making any changes to other tabs in the dialog.
Undo and Redo
Click Undo (CTRL + Z) to undo recent changes in the form. After an Undo, click Redo (CTRL + Y) to restore the last change that was undone.
Collapse
Collapse (roll-up) the form to preview a chart, or preview the results of an operation in Vizex, or obtain input values from Vizex, the Property Window, the File Editor, or the Plot Editor.
Run
Click the Run button to run the process.