Dendrogram
![]()
Dendrograms enable the visualisation of hierarchical clustering data in a graph with a tree-like structure. The similarity or difference between clusters is shown on the Y axis as a distance. Clusters that are more different will split at a greater distance, higher up the Y axis. Related clusters are connected to each other and to other related clusters by branches - similar to a genealogical chart (aka 'Family Tree').
An example of when a Dendrogram chart might be useful is in analysing whole rock geochemical assays where clusters may represent different rock types. This can be used to help validate geological logs.
Selecting branches of the dendrogram whilst displaying the data in Vizex with Sync Selection turned on provides a powerful way to investigate how geochemical clusters are related spatially.
Samples
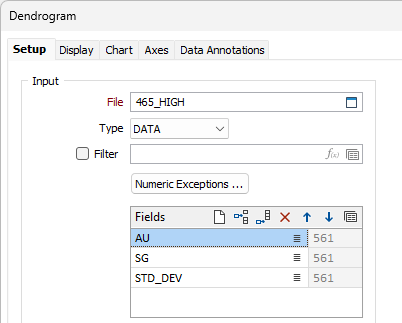
File
Select a file Type and double-click (or click on the Select icon) to select the name of the source File. If required, define a Filter to restrict the process to a subset of the records in the file.
Extra control over blank values and those with leading characters is provided by the options in the Numeric Exceptions dialog.
Fields
Records in the input file will be clustered based upon the unique values in one or more of the fields you select.
The Sample Count column is read-only and displays the count for the valid samples in each field.
Note: The total sample count is limited to 20,000. If the count is exceeded, a warning message will be displayed and you can abort building the chart.
You can use the tools in the grid to Manage the rows in the list and add fields from the input file to be considered for the resultant dendrogram.
Transformation
Select the check box to enable the transformation method options which determine the way in which the data is transformed.
Method
Choose a transformation method:
|
Method |
Description |
|---|---|
| Z-Score | Data is transformed by subtracting the mean value for each field from the values in the compositional data and then dividing by the standard deviation of each field, resulting in data with a mean of zero and a standard deviation of one. |
| Centred Log-Ratio (CLR) | A centred log-ratio transformation is undertaken to remove the effects of closure in the compositional data. |
Zero Replacement
If you selected Centred Log-Ratio as the Transformation method, choose how zero values will be handled:
-
Ignore sample
-
Treated as half of minimum positive values
![]()
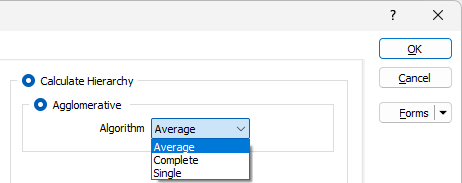
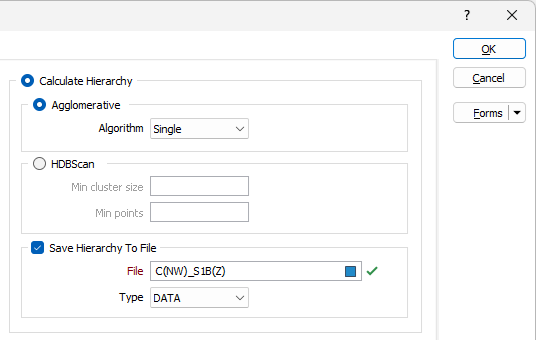
Calculate Hierarchy
To use a specified algorithm to determine the data clusters for the dendrogram, select the Calculate Hierarchy option.
Algorithm
In hierarchical clustering, different linkage methods determine how distances between clusters are calculated when merging them.
From the Algorithm drop down, you can select a cluster calculation method:
|
Method |
Description |
|---|---|
| Average | Distance between two clusters is the average of all pairwise distances between points in the clusters. The Average method produces balanced clusters and is a middle ground between single and complete linkage. It produces balanced clusters that are good for most cases. |
| Complete | Distance between two clusters is the largest distance between any two points in the clusters. The Complete method can struggle with very large datasets (over ~80K samples) but tends to create compact, well-separated clusters and is less sensitive to noise. It is good for detecting well-separated, dense clusters. |
| Single | Distance between two clusters is the smallest distance between any two points in the clusters. The Single method is faster and more memory-efficient for large datasets. It is more likely to produce long, chain-like clusters than other methods and is sensitive to noise/outliers. This method is good for very large datasets where the other methods run out of memory and good at detecting elongated clusters but may not separate well-defined groups. |
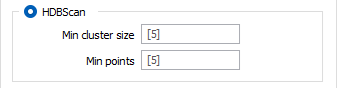
HDBScan
Select the HDBScan option to use hierarchical density-based spatial clustering to find clusters of varying densities.
Min cluster size
When HDBScan is selected, the Min cluster size field is enabled. Cluster assigning is performed based on the minimum size entered.
Min points
When HDBScan is selected, enter the minimum number of points that can be used to define a cluster by density.
Save hierarchy to file
Select the Write to file check box if you want to write the calculated clustering data to specified File.
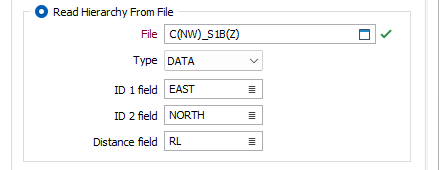
Read Hierarchy from File
If you would like to specify a file from which the clusters can be read (rather than calculate them using an algorithm), select the Read Hierarchy from File option.
File
Select a file Type and double-click (or click on the Select icon) to select the name of the File containing the cluster information.
ID 1 / ID 2 Fields
Use the ID 1 Field and ID 2 Field list buttons to specify the fields identifying the data cluster groups in the specified file.
Distance field
Use the Distance field list button to specify the field in the specified file which contains the distance information for the clustering data.
You can use the options on the Display tab of the Dendrogram form to configure the display settings of the graph.
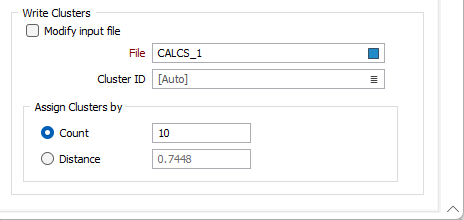
Write Clusters
You can select whether to write the cluster data to a new file, or to the Input file.
Modify input file
If this option is selected, the results of the process will be written to the Input file. If the Modify input file option is not selected, double-click (F3) to select the name of an Output file.
In the nominated file, you must specify a field to which the Cluster IDs will be written.
Assign Clusters by
Select whether to assign the written clusters by Count or Distance.
-
If you select Count, enter the number of data points to be assigned to a cluster.
-
If Distance is selected, enter the distance to be assigned for each cluster.
Assign Clusters will automatically calculate how many clusters to place the merge line at if the count or distance is blank. This value is also written back to the form set.
Forms
Click the Forms button to select and open a saved form set, or if a form set has been loaded, save the current form set.
By design, the Forms button is not available for loaded Vizex layers (i.e. when opening the form set properties of a layer in the Vizex Layer Display pane). In Vizex, the Forms button is only available for new forms opened via the Home tab or the Vizex tab, in the Layer group (or by double-clicking on a form type node in the Vizex Layer Types pane).
Save and Save As
Click the Save button to save the changes you have made to the form set. Click Save As to save your changes as a new form set. Save As will default to the first available form set number.
Reset
Click Reset to clear the form of all values and reset the form to its default state.
Reset Tab
For tabbed forms, select Reset Tab to clear the active tab of all values and reset the tab to its default state - without making any changes to other tabs in the dialog.
Undo and Redo
Click Undo (CTRL + Z) to undo recent changes in the form. After an Undo, click Redo (CTRL + Y) to restore the last change that was undone.
Collapse
Collapse (roll-up) the form to preview a chart, or preview the results of an operation in Vizex, or obtain input values from Vizex, the Property Window, the File Editor, or the Plot Editor.
Run
Click the Run button to run the process.