Display
On the Display tab of the Dendrogram form, you can configure the display settings for the dendrogram, including the line colour for branches and label display options.
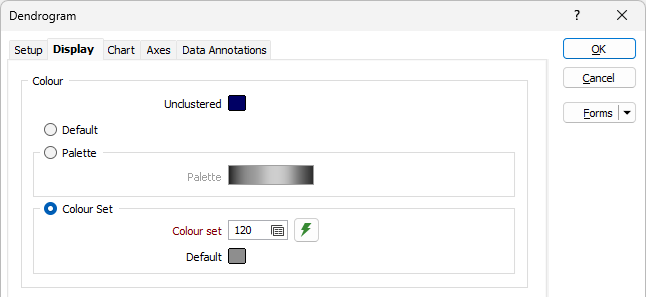
Colour
Unclustered
Double click (F3) to select the colour to be applied to unclustered data for the dendrogram.
Default
Select the Default option to apply the default colours to the dendrogram.
Palette
Select the Palette option and double click (F3) the colour bar to select a numeric colour palette to apply to the dendrogram. See Numeric Colour Sets.
Colour Set
Select the Colour Set option and double click (F3) in the Colour set field to select a Text colour set to apply to the dendrogram. See Text Colour Sets.
You can also click the Generate colour set button to create a colour set based on a palette and maximum cluster count.
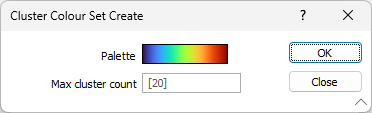
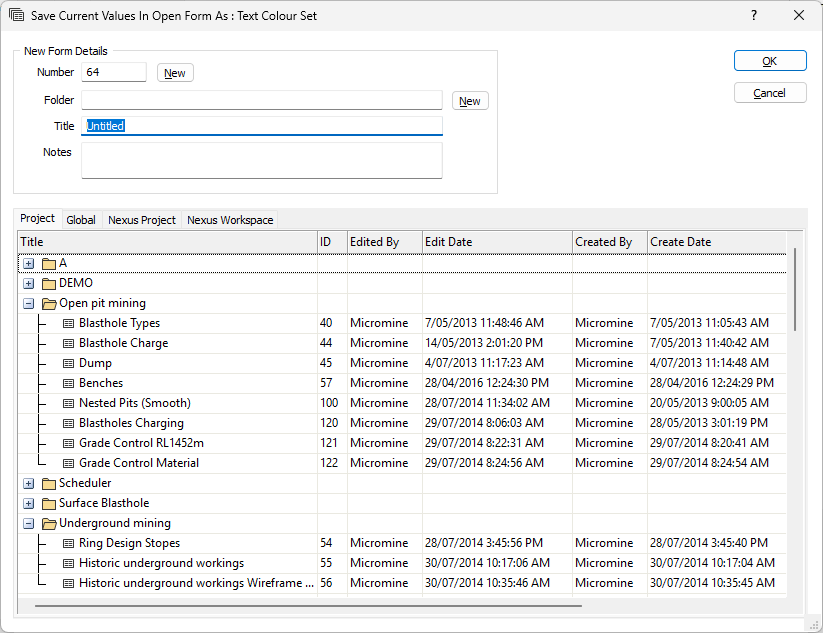
Double click the Palette colour bar to select a palette and enter a Max cluster count to create the colour set. The form set manager will open and you can give the new colour set a name and save it.
Click OK to select the new colour set for the dendrogram.
Default
Double-click (F3) to select the colour that will be used when a Colour field or a Colour set is not defined - or when a value in the Colour field is either not valid or is not mapped in the Colour set.
Distance
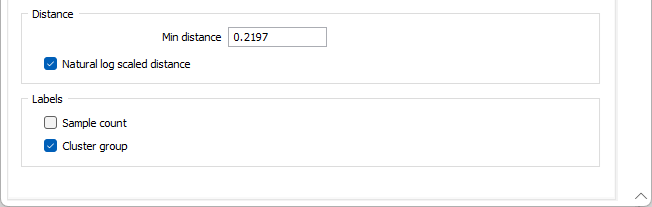
Min Distance
Enter a value for the Minimum Distance to be displayed on the dendrogram chart. The value entered will determine the minimum Distance value on the Y axis of the chart. This can be useful if you would like to simplify the dendrogram.
Natural log scaled distance
Select the Natural log scaled distance check box to enable lognormal scale for the graph. This will scale the distance data values and set the Y axis to natural log scaled.
Labels
Sample count
Select the Sample count check box to display sample count labels on the dendrogram for each data cluster.
Cluster group
Select the Cluster group check box to display labels on the dendrogram for each cluster group.