Change of Support
![]()
In mining, the samples obtained from drilling are much too small to represent the mining blocks of a mine. To get around this problem, groups of samples are combined to produce a larger volume, called a selective mining unit or SMU. Calculations are used to adjust the samples into something which represents the SMU contents. This calculation is called Change of Support.
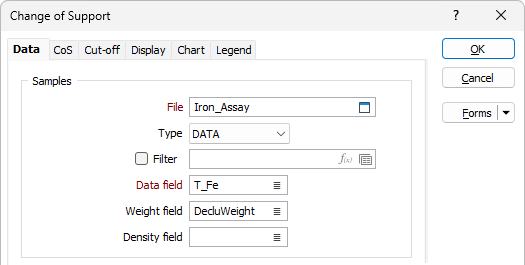
Data
Samples
Use the Data tab of the Change of Support form to select the data on which you want to perform the transformation. The option to validate against a block model is provided.
File
Double-click (or click on the Select icon) to select the name of the input file. If required, define a filter to restrict the process to a subset of the records in the file.
Data field
Click on the List icon to select the associated raw data field in the input file.
Weight field
(Optionally) Double-click to select a Weight field in the input file. The weight field will typically contain the declustered weights of the samples. If a Weight field is specified, the statistics and the results shown on the chart are weighted.
Density field
(Optionally) Double-click to select a Density field in the input file. The Density field is used to calculate the tonnage contribution (%) for each point/block on the grade tonnage curve graph.
Validate Against Block Model
Select this check box to validate the support grade distribution against the estimated grade distribution. The block model will typically be from a previous Kriging or IDW run, using the same input sample data.
File
Double-click (or click on the Select icon) to select the name of the input file. If required, define a filter to restrict the process to a subset of the records in the file.
Data field
Click on the List icon to select the associated raw data field in the input file.
Density field
(Optionally) Double-click to select a Density field in the block model file. The Density field is used to calculate the tonnage contribution (%) for each point/block on the grade tonnage curve graph.
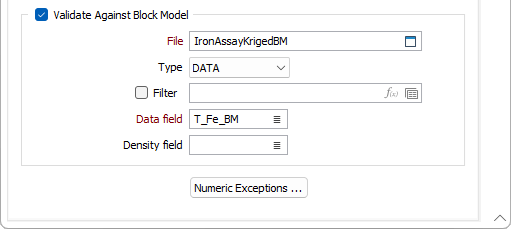
(Optionally) Use the Numeric Exceptions group to control the way that non-numeric values are handled. Non-numeric values include characters, blanks, and values preceded by a less than sign (<).
OK
Finally. click OK to generate the chart. See: Chart | Change of Support