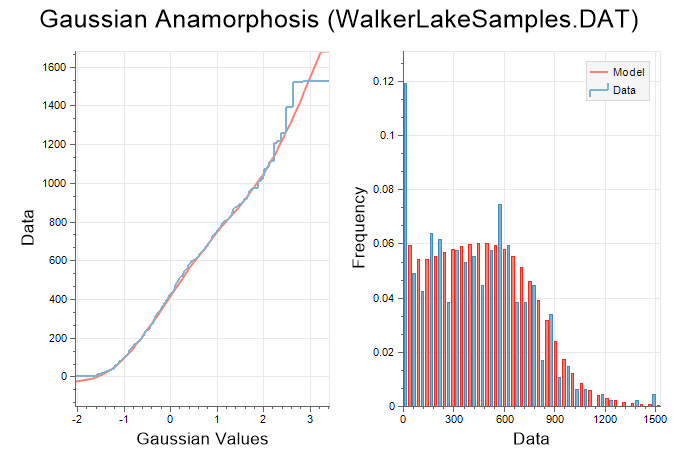
Chart | Gaussian Anamorphosis
The left-hand view displays the Gaussian values of the input data, along with the fit of the polynomial function. The right-hand side of the chart displays the histograms of the model (red) and raw data (blue).
The application uses Hermite polynomials to create a piecewise polynomial function that matches the raw data distribution. Use the spin control near the top of the chart to adjust the number of Hermite polynomials within the range of 1 and 200. However, because each increment adds complexity, you should aim for the smallest number of Hermite polynomials that fit the data.
Once you are satisfied with the fit of the polynomial, you can use the Gaussian data field like any normal variable.
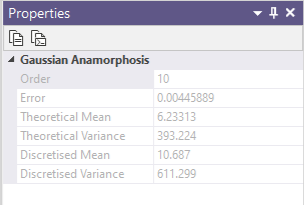
On the Chart | Gaussian Anamorphosis tab, in the Gaussian Anamorphosis group:
-
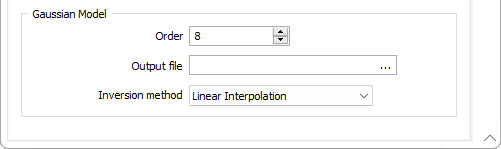
Use the Order increment and decrement controls to control distortion so that the curve of the Gaussian distribution closely matches your data.
- If you make any changes to the Gaussian data field during Gaussian Anamorphosis Modelling, you must back-calculate it into real-world values. To do so, on the Stats tab, in the Transformation group, select Gaussian Anamorphosis | Back Calculation and supply the Gaussian data and Gaussian model, along with a name for the back-transformed data.
![]()
Load a Chart Form Set
To display an existing form set in a new chart:
- Click the Forms button at right of the form and choose the form set.
- Click OK to apply the settings to the new chart.
Errors at this point will typically refer to a new chart feature with no equivalent in the old graph. To assist you, the application will highlight the offending form response once you read and dismiss the error message.
When you generate a chart, many of the tools and options on the Chart ribbon are common to most charts. See: Chart Tools