Summary
The Summary tab is used to determine the information that will be displayed in the Summary for the interpolation after completion.
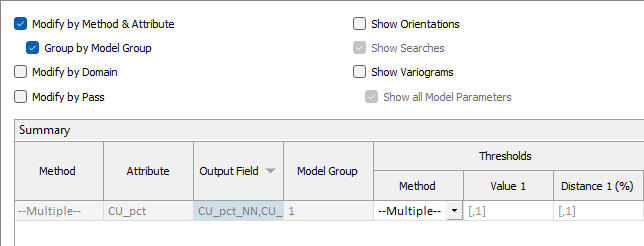
Options at the top of the tab are used to select the information to be displayed, while the Summary grid displays a preview of the selected values. The available options are as follows:
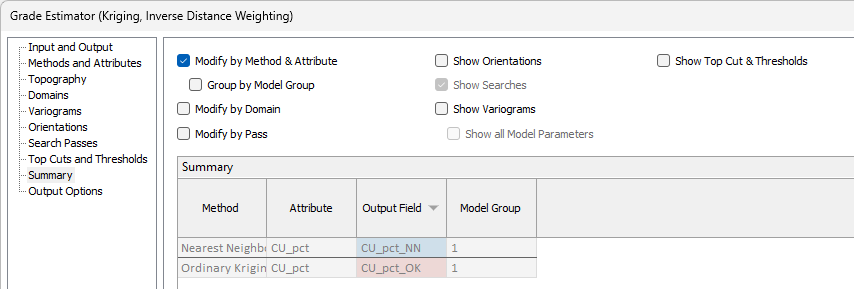
Modify by Method & Attribute
If you select the Modify by Method & Attribute option, the Method, Attribute, Output Field and Model Group details from the Methods/Attributes tab will be displayed in the Summary. If you select the Group by Model Group option, the details will be grouped by Model Group:
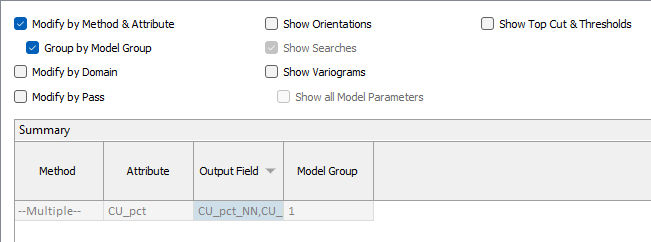
You can sort the Sumamry grid by Output Field using the column label to toggle sort direction.
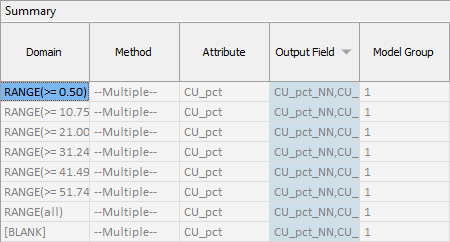
Modify by Domain
With the Modify by Domain option selected, the Domain details will be added to the Summary:
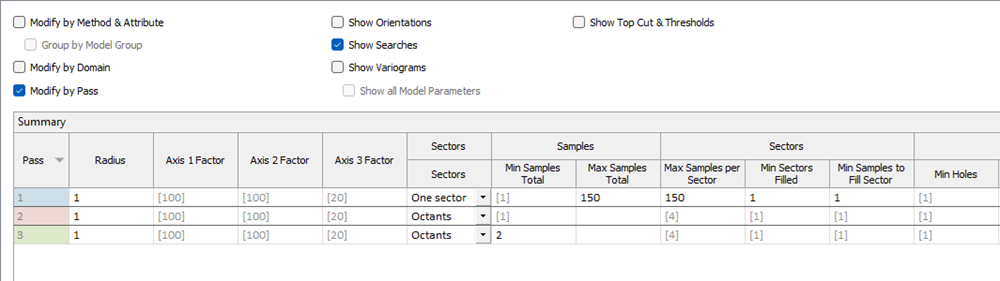
Modify by Pass
If the Modify by Pass option is selected, the specified information for each individual Search Pass will be included in the Summary. For example, the following screen shows Searches by Pass:
Show Orientations
If you select the Show Orientations option, orientation method information will be displayed in the Summary. Selecting an orientation method will determine the values that are displayed - see Orientations. If Variograms exist for the interpolation, Dip Dir, Dip and Pitch information for Variograms will also be displayed.
Show Searches
If Modify by Pass is selected, the Show Searches option is enabled. Select the option to display radius and axis information on the searches for each pass in the Summary.
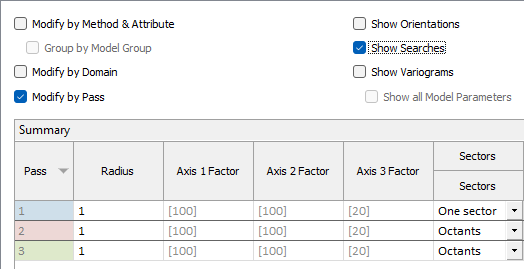
The Pass column label can be used to sort the Summary grid.
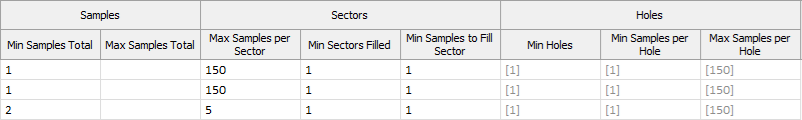
Information on the Samples, Sectors and Holes for each search pass is also displayed:
Show Variograms
With the Show Variograms option selected, information on the Kriging variograms is displayed.
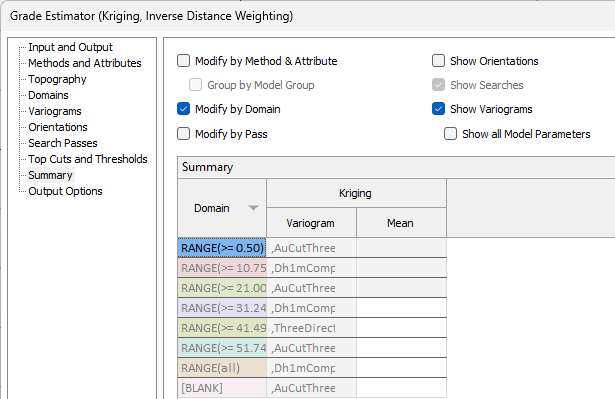
The Mean column displays the Kriging mean for the domain variogram.
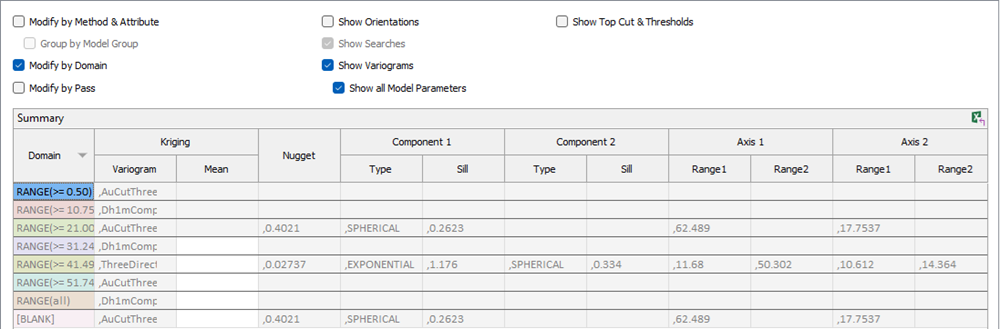
If you select the Show all Model Parameters option with Show Variograms, information on the Nugget, Components and Axes for the domains is displayed:
Show Top Cut & Thresholds
With the Show Top Cut & Thresholds option selected, the Top Cuts/Thresholds details for the estimation will be displayed in the Summary.
Export to Excel
The configured Summary grid can be exported to an XLSX or CSV file using the icon ![]() in the top right corner of the grid to open the Export to Excel form:
in the top right corner of the grid to open the Export to Excel form:
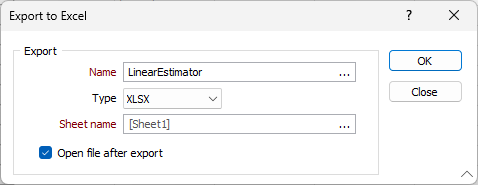
Enter a Name for the exported summary and use the Type drop down to select either XLSX or CSV format.
Optionally enter a Sheet name for the XLSX file or accept the automatic default.
If you select the Open file after export option, the exported file will be opened in Microsoft® Excel.