Multiple Indicator Kriging
![]()
For Indicator 1 cutoff:
- Assign 1 or 0 to each record (in the Input file) depending on whether the value of the Analysis field is below (1) or above (0) the cutoff value.
- These values are now kriged (using the associated Variogram Model) and written to a new field (Cutoff1) in the block model file (these fields are later deleted if "Write cutoff values?" is not selected). The value written to this field is the estimated portion of the block that is below the cutoff grade (probability).
- In the new field, replace any value less than 0 with 0
- In the new field, replace any cutoff value greater than 1 with 1
For Multiple Indicator Kriging
- Repeat steps 1 to 4 for the other Indicator cutoff grades.
Now check that the cutoffs (1 to n) for each record in the block model are in ascending order (equal values are OK). An invalid sequence can occur because each cutoff may use a different variogram model. For each record:
- Create an upward adjusted set of cutoffs so that if Cutoff(n) is less than Cutoff(n-1) then Cutoff(n) = Cutoff(n-1).
- Create a downward adjusted set of cutoffs so that if Cutoff(n-1) is greater than Cutoff(n) then Cutoff(n-1) = Cutoff(n).
- Mean the upward and downward sets to calculate the final values.
Subsequent calculations (below) refer to "bins". The first bin contains all the values, from the Input file, that are lower than the first Indicator cutoff grade. The second bin contains all values between the first and second Indicator cutoff grade. The final bin contains all values above the last Indicator cutoff grade. To handle calculations for the final bin an additional (dummy) Cutoff column (Cutoff(n+1)) is generated, which will have a value of 1 for each block.
To calculate the estimated value for each block, sum the products of each bin probability and the grade estimate for each bin. The bin probability is simply the difference between the probabilities of consecutive Cutoff fields. So the probability of the block's grade being in the first bin equals the value in the Cutoff(1) field.
The probability of the block's grade being in the second bin equals Cutoff(2) - Cutoff(1) and the probability for the last bin equals 1 - Cutoff(n). The calculation of the grade estimate for a bin depends on the method selected for that bin:
- MEDIAN uses the median of all the input grades that are within the bin limits.
- MEAN uses the mean of all the input grades that are within the bin limits.
- LINEAR uses the mean of the Indicator cutoff grades that define the bin. The lower value for the first bin, and the higher value for the last bin, can be defined by the user in the "Grade Estimate (Tails)" group box. If not specifically defined, the first bin (Lower tail) uses 0 as its lower value and the last bin (Upper tail) uses the maximum grade value (from the Analysis field in the Input file) as its higher value.
The estimated block value is written to a field in the block model file with the same name as the Analysis field in the Input file.
Input Data
On the Input Data tab of the Multiple Indicator Kriging form, enter (or double-click to select) the name of the input file. If required, define a filter to selectively control which records are processed.
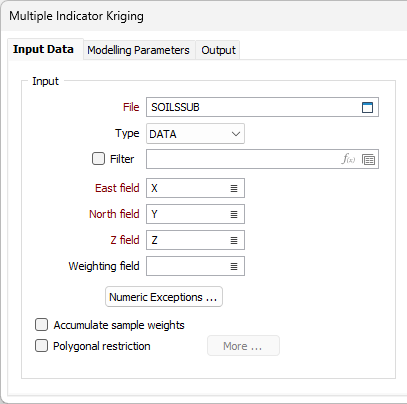
East, North, Z fields
Double-click (or click on the List icon) to select the coordinate fields in the Input file.
Weighting field
Optionally double-click (or click on the List icon) to select the name of a field that contains sample weight.
If a Weighting field is specified, per-sample distance weights are calculated as normal, multiplied by the sample weight, and then rescaled so that they sum to 1. The weight of each sample is also written to the verbose report file.
Numeric Exceptions
(Optionally) Use the Numeric Exceptions group to control the way that non-numeric values are handled. Non-numeric values include characters, blanks, and values preceded by a less than sign (<).
Accumulate sample weights
Select this option if you want to keep a running sum of the weight allocated to each input sample for each block estimate, and write the sum of all weights per sample back to the Input file.
An accumulated sum of the weights is useful in showing how much each sample contributed to the resulting model.
Polygonal Restrictions
Optionally, select the Polygonal Restrictions option and click the More button to restrict which points are used in the estimates. For more details, refer to the Polygonal Restriction topic.
Blocks from file
As an alternative to explicitly defining the block size and quantity, select this option to define blocks from a file and specify the file and fields that contain block definitions.
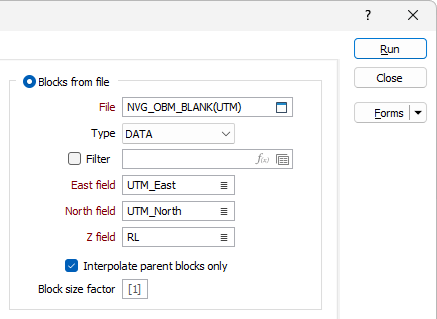
Interpolate parent blocks only
If you are defining blocks from a file, select this option if you want to restrict the process so that it includes parent blocks only.
If the Blocks from File option selected, the function will operate differently depending upon whether it is the first run (when the Output file is created) or a subsequent run (when the Output file is updated). Typically, on the first run, fields are added to the Output file, while the content of those fields are updated on subsequent runs (when the Output file name is copied as the Blocks from File file name). If necessary, fields can still be added on subsequent runs.
Block size factor
The block size factor allows a user-defined block size to be used for the interpolation of the grades to the block model. If specified, the block factor will be a (2, 3, 4, etc.) multiple of the parent block size.
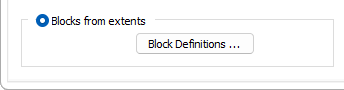
Blocks from extents
Block Definitions
Click the Block Definitions button to define the size of the blocks and the extents within which estimates will be calculated.
You can also rotate the block model by defining an angle of rotation or using the rotation of a search ellipsoid. See: Block Model Extents
Forms
Click the Forms button to select and open a saved form set, or if a form set has been loaded, save the current form set.
Run
Enter parameters in the Parameters and Output tabs, then click Run to run the function.