Series
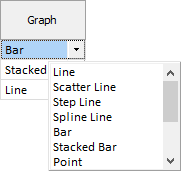
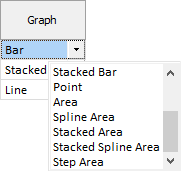
When you select the type of graph for each series on the Input tab of the Multi-purpose Chartform, you can select from the following options:
Series variants
-
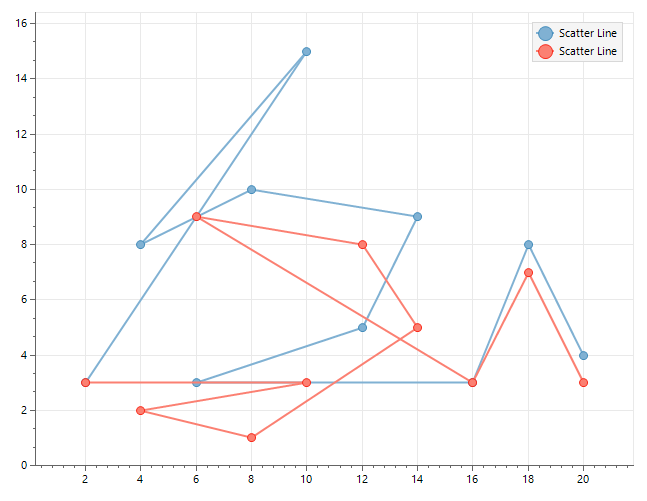
Scatter: Means that when the line is drawn between the points, they are not sorted by their x-value first. So this does not guarantee that the line will travel from left to right of the chart.
-
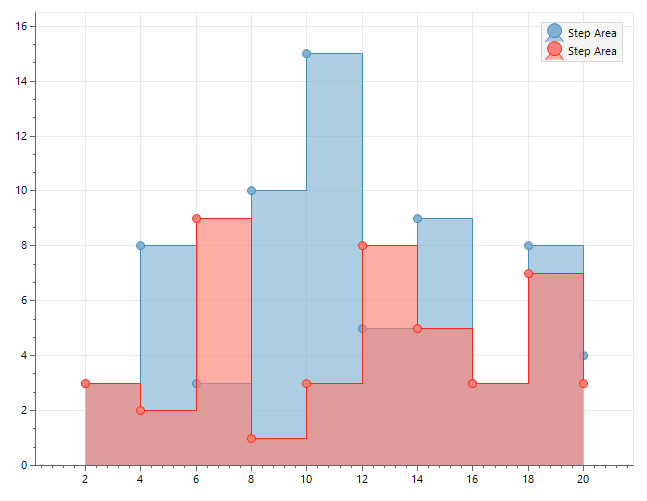
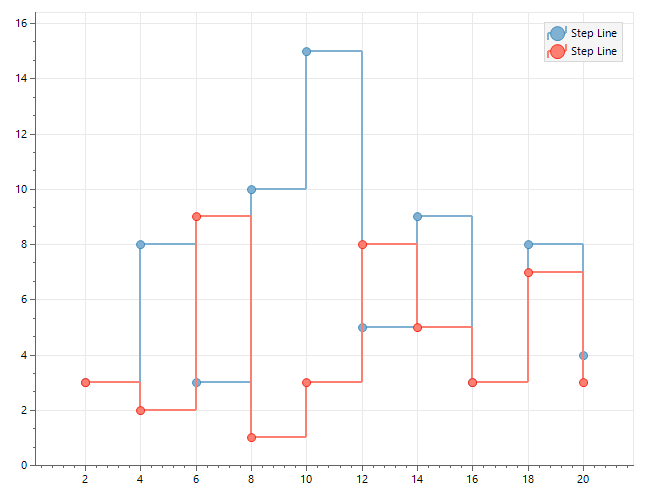
Step: Means that the line between each point is in a step shape, rather than straight from one to the other. The “Inverted steps” option will invert the shape of these steps.
-
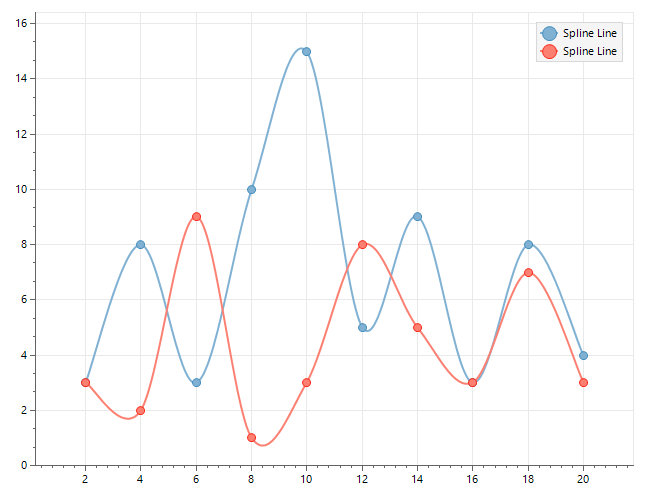
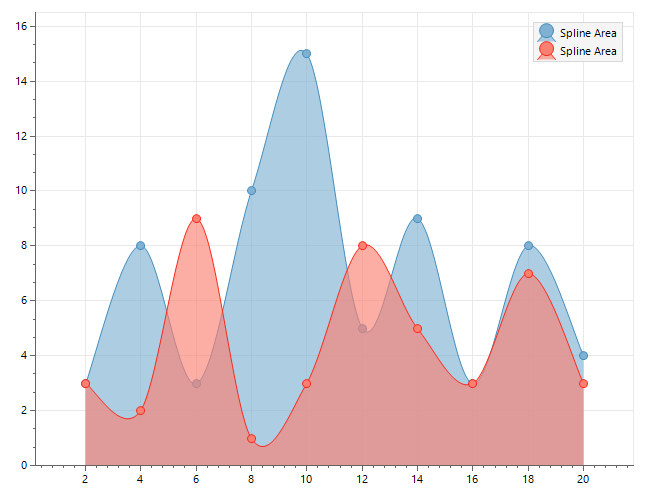
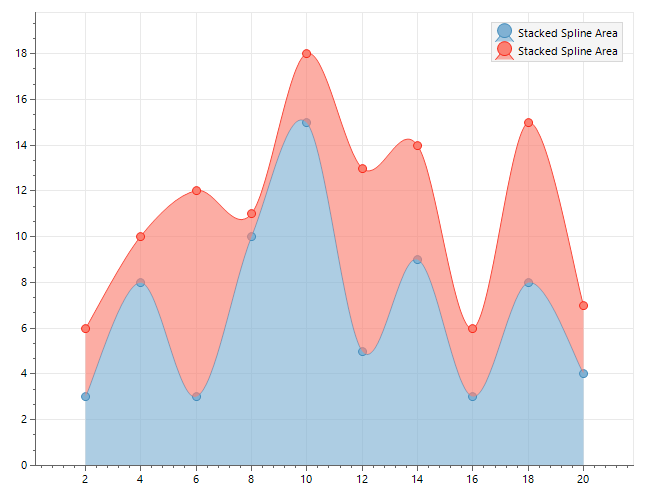
Spline: Means that a curvy spline will be drawn from one point to the other, rather than a straight line.
-
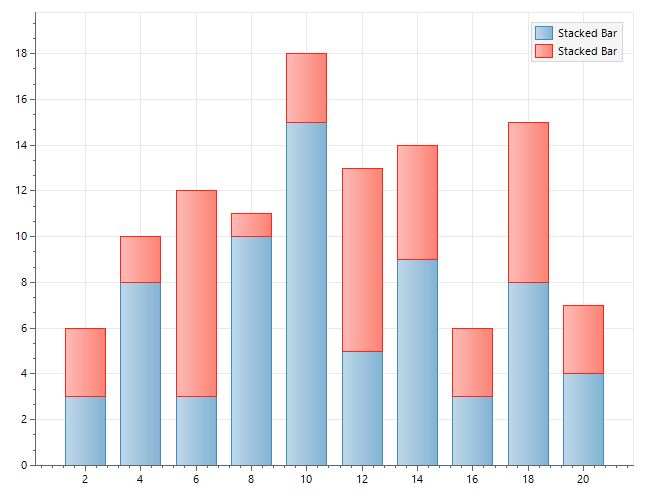
Stacked: Means that when there are at least two series of the same stacked series type, and they share the same x-values, they will be stacked on top of each other, rather than side by side or overlapping.
Series types
Line
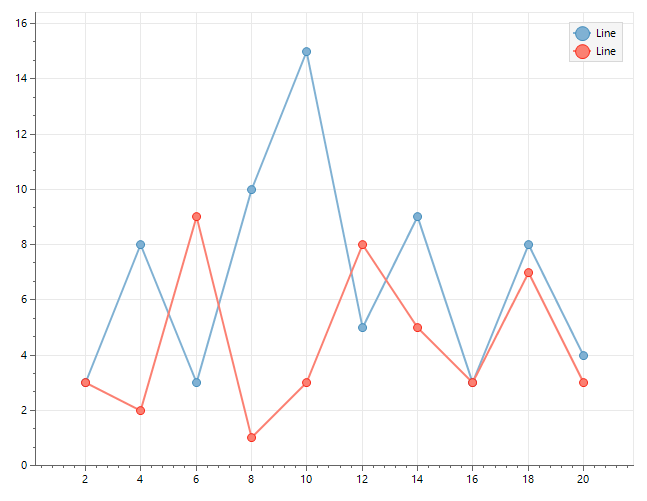
A simple line series, with each point being connected by a line to the next.
Line:
Scatter Line:
Step Line:
Spline Line:
Bar
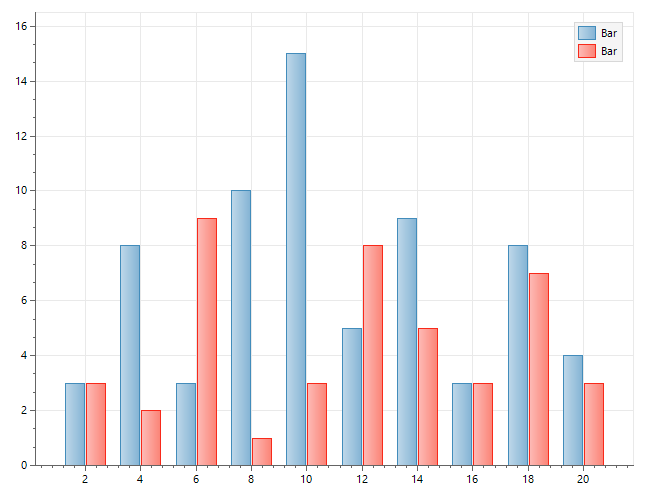
Each point will be displayed as a bar, with the x-value being the centre of the bar on the x-axis, and the y-value being the height of the bar.
Bar:
Stacked Bar:
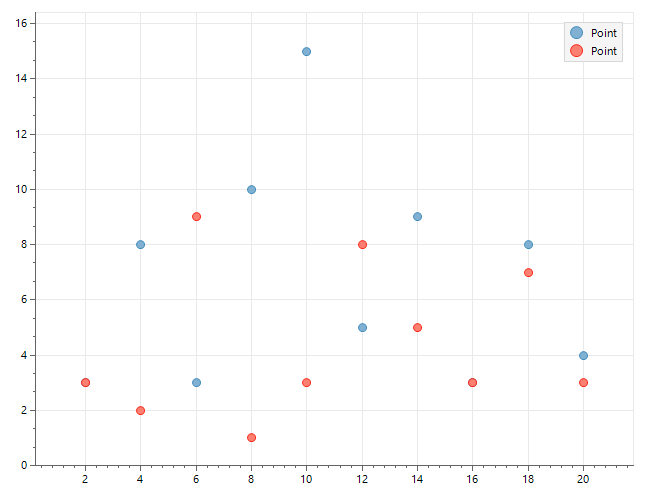
Point
Simply just plots each point with no other decoration.
Point:
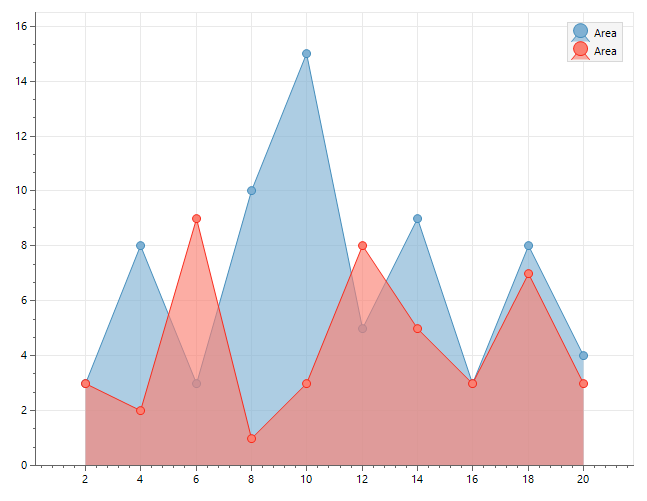
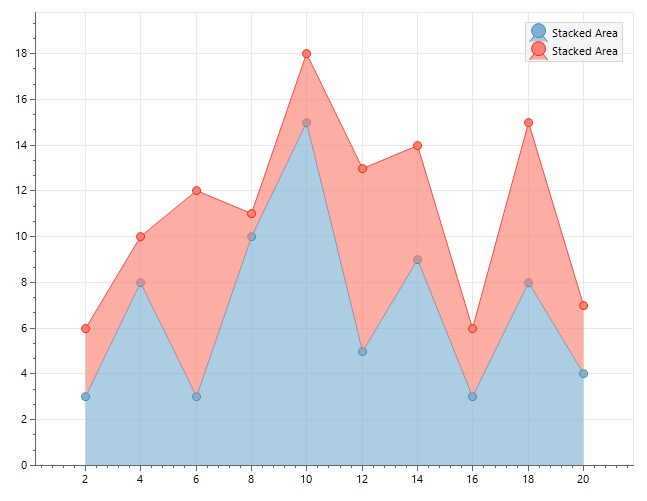
Area
Plot the series like a line series, except the area under the series is shaded:
Area:
Spline Area:
Stacked Area:
Stacked Spline Area:
Step Area: