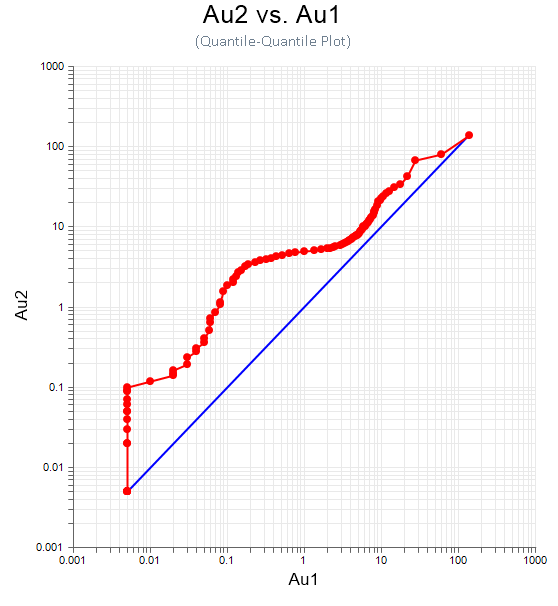
Chart | Q-Q Plot
In the Q-Q Chart, information about the plot is displayed in a Properties Table on the chart itself (if you select the Show Properties Table option on the Chart | Q-Q Plot tab) .
![]()
When you generate a chart, many of the tools and options on the Chart ribbon are common to most charts. See: Chart Tools