Q-Q Plot
![]()
Input Data
You specify the data on the Input Data tab. This chart always requires a file for the Y-axis, and either a file or a theoretical distribution for the X-axis. The number of quantiles determines the number of points on the chart. A typical number for a large dataset is 100 (i.e. percentiles); smaller datasets may require fewer quantiles. Enabling Show Y = X line on the Display Options tab will display the reference line, which is essential for comparing the distributions.
Y Axis
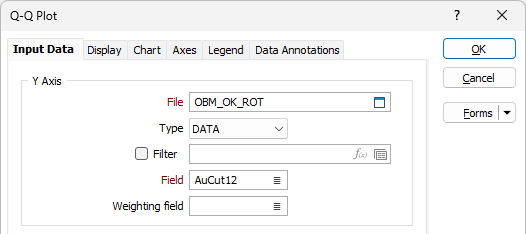
File
Double-click (or click on the Select icon) to select the name of the Input File for the Y axis. If required, define a Filter to selectively control which records to process.
Field
Double-click (or click on the List icon) to select the field you want to plot along the Y axis of the Q-Q Plot.
Weighting field
Optionally enter (or double-click to select) the name of a Weighting field. When a Weighting field is applied, weighted means, standard deviations, confidence intervals and variances will be written to the Statistical Summary Report file. If no Weighting field is specified, un-weighted values will be written to the file.
X Axis - File
For the X Axis, select an option to either define a File/Field distribution (as per the Y axis), or define a Theoretical distribution:
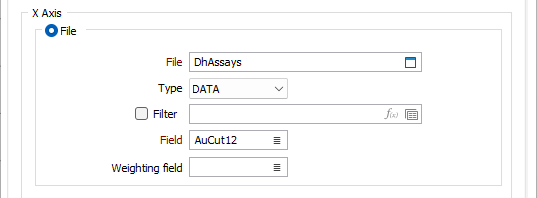
File
You use the File option to compare the Y-axis data with another dataset. Double-click (or click on the Select icon) to select the name of the Input File for the X axis. If required, define a Filter to selectively control which records to process.
Field
Double-click (or click on the List icon) to select the field you want to plot along the X axis of the Q-Q Plot.
Note that default labels in charts often use the input field name to label the data being plotted. If these fields are expressions, then the expressions will be used as the label text. To avoid this, you can use an additional attribute to define the label. See: Output Field Name Attributes
Weighting field
Optionally enter (or double-click to select) the name of a Weighting field. When a Weighting field is applied, weighted means, standard deviations, confidence intervals and variances will be written to the Statistical Summary Report file. If no Weighting field is specified, un-weighted values will be written to the file.
X Axis - Theoretical
You use the Theoretical Distribution option to compare the Y-axis data with a theoretical distribution. Define a Theoretical distribution by specifying the following additional parameters:
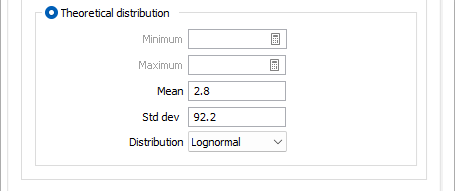
Minimum and Maximum
When the Distribution is UNIFORM, enter Minimum and Maximum values to limit the extents of the distribution. Alternatively, click the Calculate buttons to obtain the values from the Y-axis file.
Mean
For NORMAL, LOG NORMAL and EXPONENTIAL distributions, optionally enter the arithmetic mean of the sample data. Leaving the entry blank will automatically obtain the mean from the Y-axis data.
Std dev
Optionally enter the sample standard deviation of the data values, or leave the entry blank to automatically obtain the standard deviation from the Y-axis data.
Distribution
Select the type of distribution:
| Type | Description |
|---|---|
| Normal | For data that is evenly distributed around the mean and exhibits a normal or Gaussian distribution. |
| Uniform | For data in which every value is equally likely to occur. |
| Lognormal | For data whose natural logarithms are normally distributed. |
| Exponential | For data with an exponential distribution (a large number of near-zero values progressively tapering to a very small number of large values). |
(Optionally) Use the Numeric Exceptions group to control the way that non-numeric values are handled. Non-numeric values include characters, blanks, and values preceded by a less than sign (<).
Report File
Enter (double-click or click on the Select icon) to select the name of the Report File that will be written as a result of the process. To see the contents of the file, right-click in the file box and select View (F8).